Download
1 / 26
270 likes | 319 Vues
This study analyzes the carbon balance of terrestrial ecosystems in China during the 1980s and 1990s. It explores the impact of climate change, human activities, and vegetation types on carbon storage. Utilizing various methods and data sets, the research assesses carbon uptake and emission from forests, crops, shrubs, grasslands, soil, and fires. The findings reveal a significant carbon sink in China, influenced by factors such as reforestation, agriculture practices, and regional climate changes. The study estimates carbon offsets and emphasizes the importance of conservation efforts for maintaining ecosystem health.

E N D
The carbon balance of terrestrial ecosystems in China during the 1980s and 1990s Shilong Piao, Jingyun Fang, Philippe Ciais, Philippe Peylin, Yao Huang, Stephen Sitch, Tao Wang April 2009
Regional C budget (hi)story • in 1998, a very controversial study by Fan et al. finds a huge NA sink ‘seen from the atmosphere’ (1.7 Pg C / yr) • in 2001, Pacala et al. estimate C budget in USA (0.3-0.58 Pg C / yr) • in 2003, Janssen et al. estimate C budget in Europe (0.14-0.21 PgC/yr) • in 2007, Stephens et al. Estimate a NH sink of 1.5 ± 1.5 Pg C / yr much smaller than in prevous inversions studies -> this call for an assessment using bottom up data • China?
Spatial distribution climae Mean annual temperature Annual Precipitaion
NPP (gC / m2 / yr) Distribution of NPP in China
Afforestation/reforestation projects • China contributed about one quarter of the global plantation area. • Forest plantation benefit net carbon uptake Kauppi et al., (2006)
Significant climate change Temperature change Precipitation change • During the past two decades, mean annual temperature over China increased by more than 0.5 ºC/decade. • Warmer-dryer in the North and warmer-wetter in the South where most productive ecosystems are distributed. Based on CRU climate data (Mitchell et al., 2003)
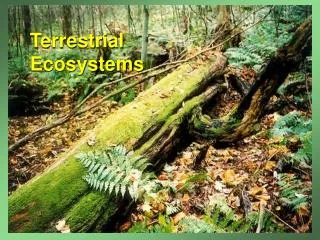
Forest Shrub Crop Grassland HOW DID CARBON STORAGE RESPOND TO CLIMATE AND HUMAN DISTURBANCE OVER THE PAST 20-YEARS?
Methods used in this study 1000 km Atmospheric inverse Model 10 km Upscaling Prediction ha dm Downscaling Verification + Integration by modeling (Moses-Triffid; LPJ; Sheffield-DGVM; Hyland; ORCHIDEE)
Datasets 1. Forest inventories and field biomass data ~200,000 permanent and temporary sample plots, 5 periods: 1977-81, 1984-88, 1989-93, 1994-98, 1999-2004 2. Grassland biomass inventory data 3. Cropland SOC survey data, statistics for crop yield, area, and others 4. NDVI datasets The NDVI data were from the GIMMS (Global Inventory Monitoring and Modeling Study) group derived from NOAA/AVHRR land dataset, with 8 km resolution for each 15 days from 1981 to 1999.
Forest Crop Shrub Grassland Inventory and satellite based estimation 75±35 Tg C/yr 13±1 Tg C/yr 7±3 Tg C/yr 22±10 Tg C/yr vegetation 4±4 Tg C/yr 6±1 Tg C/yr 26±11 Tg C/yr 39±9 Tg C/yr Soil Fire Bamboo Total net C balance - 3 Tg C/yr 1±1 Tg C/yr (?)
Forest Crop Shrub Grassland Inventory and satellite based estimation 75±35 Tg C/yr 13±1 Tg C/yr 7±3 Tg C/yr 22±10 Tg C/yr vegetation 4±4 Tg C/yr 6±1 Tg C/yr 26±11 Tg C/yr 39±9 Tg C/yr Soil Fire Bamboo 177±73Tg C/yr = - 3 Tg C/yr 1±1 Tg C/yr Limitations: Not included wetland; trees out forests (four-side trees and individual tress)
Atmospheric inversion estimation Prior flux information LMDZ transport model observations Optimized fluxes The mean result of the inversion ensemble over the period 1996 – 2004 is a net CO2 uptake of0.35 Pg C/yr. Limitations: scarce atmospheric netwrork (only 9 sites in North Asia) and uncertainty from transport model
The link between inventory and atmospheric inversion estimation
NEP vs. fossile fule CO2 emission Raupach et al., (2007)
Why large C sinks? ●large-scale reforestation ●changes of energy consumption structure and vegetation recovery ●intensive agriculture practices ●regional climate changes
Countries with the largest proportion of the world’s forest plantations, 2000 % of total global plantation area ▲ (i) Reforestation and afforestation China is the largest country with planted forests, about 1/4 of total global plantations (FAO, 2001) FAO (2001)
(ii) Change of energy consumption strucure and recovery of vegetation In the last 30 yrs, firewood, charcoals, and crop straws that had been used as major energy sources in the most rural areas have been steadily replaced with fossil fuels. This on the one hand has increased the consumption of fossil fuels, but it accelerated the recovery of vegetation, especially of scrubs. Movement of rural residents to cities reduced pressure to nature.
(iii) Intensive agriculture practices expansion of straw incorporation, shallow plowing, irrigation, and no-till farming have increased C sequestration in agricultural soils.
Summer Spring Autumn (iv) Regional climate changes Inter-annual changes in seasonal precipitation Despite no significant change in annual rainfall, summer precipitation in China has significantly increased by 2.5 mm each year over the last 2 decades.
Comprehensive estimate of Chinese ecosystems carbon budget A carbon sink of 0.19 to 0.26 Pg C / yr Offsets ≈ 28-37% of emissions over 1980-2000 Offsets ≈ 16-22% of emissions over 2001-2005 50% forest; up to 30% in shrublands More than 65% of the sinks are distributed in southern China owing to regional climate change, reforestation and afforestatioin programmes acive, and shrubland recovery. Recent trends in agricultural practice also cause an increase in carbon sequestration. Conclusions
JanssensIA. et al. (2003), Europe's terrestrial biosphere absorbs 7 to 12% of European anthropogenic CO2 emissions. Science, 300, 1538-1542. Kauppi PE, Ausuble JH, Fang JY, Mather A, Sedjo RA, Waggoner PE (2006), Returning forest analyzed with the forest identity. PNAS, 103, 17574-17579 Mitchell TD, Jones PD (2005), An improved method of constructing a database of monthly climate observations and associated high-resolution grids. Int. J. Climatol, 25, 693-712 Pacala SWet al. (2001),Consistent land- and atmosphere-based US carbon sink estimates. Science, 292, 2316-2320. Piao SL, Fang JY, Ciais P, Peylin P, Huang Y, Sitch S, Wang T (2009),The Carbon balance of terrestrial ecosystems in China. Nature, doil:10.1038/nature07944 [in press] Raupach MR, Marland G, Ciais P, LeQuere C, Canadell JG, Klepper G, Field CB (2007), Global and regional drivers of accelarating CO2 emissions. PNAS, 104, 10288-10293 References