Download
1 / 33
330 likes | 512 Vues
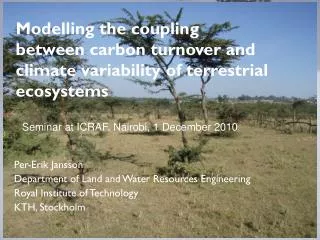
Modelling the coupling between carbon turnover and climate variability of terrestrial ecosystems. Per-Erik Jansson Department of Land and Water Resources Engineering Royal Institute of Technology KTH, Stockholm. Seminar at ICRAF, Nairobi, 1 December 2010. Outline of presentation.

E N D
Modelling the coupling between carbon turnover and climate variability of terrestrial ecosystems Per-Erik Jansson Department of Land and Water Resources Engineering Royal Institute of Technology KTH, Stockholm Seminar at ICRAF, Nairobi, 1 December 2010
Outline of presentation • Some general features of the CoupModel representing coupled ecosystem processes • Examples of how model has been used to describe specific sites with detailed measurements, regional scale with only standared data and climate scenarious • Some implications for future studies
A process oriented Ecosystem model - CoupModel Coupled heat and mass transfer model for soil-plant-atmosphere systems
Model Availability and Features http://www.lwr.kth.se/Vara%20Datorprogram/CoupModel/index.htm Includes documentation and tutorials
Transpiration is a function of net radiation and resistances in plant and atmosphere Photosynthesis is a function of light and the stomata resistance Transpiration and Photosynthesis LAI
Modelling of carbon dynamic of Swedish forest soils • Using models for interpretation of data and for upscaling • Development of procedures for calibration and upscaling using Bayesian calibration methods • Producing results for various scales
To start... • We have simple data from large regions and detailed data from some few sites • The few sites (Lustra CFS) and regional Forest inventory have been used together • The model has been used as a tool to understand and to make upscaling and downscaling 1 yr x
3 steps ... • (1) estimation of parameters from regional data – 100 years. • (2) site specific data were used to calibrate the model for Flakaliden (dry mesic) and Asa (wet). • (3) climate change scenarios (A2, B2) were used together with parameters from the regional site (1) on a 100 year perspective for dry-mesic sites. 1 yr
N Regional approach • Objective: Estimate trends in soil C storage • Approach: Regional scale with representative sites • Data: Standing tree biomass and soil C and N pools
N Regional input data
Soil C change (g C m-2 yr-1) N • Different decomposition rate coeff. along Swedish transect Decomp. rate coeff. (kh) • Need for another source of N in addition to mineralised N • Current soil C pools in the south increases whereas central and northern soils are close to steady state Organic N uptake Versus min N Uptake
Tree and Fieldlayerdynamicsimportant for modelling long term dynamics South North
N Flakaliden-calibration Objective:Quantify major fluxes of C, heat and water includinguncertaintyestimates Approach:Bayesianuncertaintytheory Data: • Standing treebiomass and soil C and N pools • Internalfluxes i.e. litterfall, rootlitterproduction and DOC • Eddyfluxmeasurements of CO2, heat and water • Soilphysicalproperties • Soiltemperature
Uncertaintyestimates 644±74 570±55 363±43 138±37 207±31 -69±18
N Climatechange scenarios • Objective: Effects on C-budget and on governing and limiting factors due to climate change • Approach: Climate change of regional approach • Data: IPCC climate change scenarios Hadley A2 and B2
Different response on key components of ecosystemenvironment
Climate change effect on tree growth and soil C change • NEP increased in all regions along the Swedish transect. • Major part of the increase related to tree growth.
Implications for future • Use best uncertainty methods to allow for estimations probabilistic distributions of parameters for specific field investigations • Make simulation experiments to understand uncertainties of coupled models rather than single submodels
Coupled models are necessary to understand long term behaviour of ecosystem • Soil climate is strongly coupled with vegetation and atmopheric climate • Soil physical conditions are a dynamic forcing for nitrogen and cabon turnover • Dynamic description of plant cover need to include both field and canopy layers for Swedish forest • Carbon, Nitrogen, Water and Heat have to be considered together
100 yr x 1 yr x x Site Region Current Climate and Management • Upscaling and downscaling is now possible with flexibility and transparency but... • Uncertainties are still very difficult to express for the regional scale • Site specific data has generated new knowledge but no easy answers for upscaling… Future Climate and Management
Last comment • An adviser who believes too much in the figures from a mathematical model will be equally poor as the one who fully trusts results from field investigations.
Thanks for Thanks for your attention