Periodic Gene Expression Analysis using Functional Data Analysis (FDA)
This article explores the limitations of using PCA for analyzing high-dimensional gene expression data with low sample size. It introduces the concept of Functional Data Analysis (FDA) and demonstrates its application in identifying periodic genes in yeast cell cycle data. Additionally, it discusses adjusting for source and batch effects in breast cancer data using Distance Weighted Discrimination (DWD) technique.

Periodic Gene Expression Analysis using Functional Data Analysis (FDA)
E N D
Presentation Transcript
Object Orie’d Data Analysis, Last Time • Organizational Matters http://www.unc.edu/~marron/UNCstat322-2005/HomePage.html • Matlab Software • Time Series of Curves • Chemometrics Data • Mortality Data
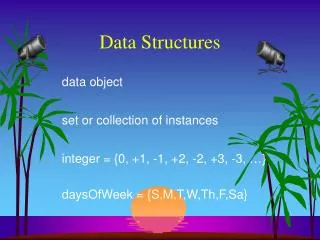
Data Object Conceptualization Object Space Feature Space Curves Images Manifolds Shapes Tree Space Trees
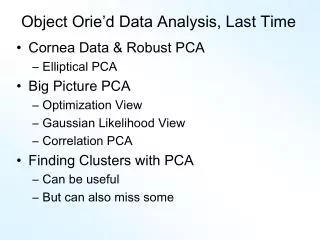
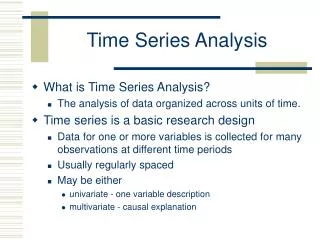
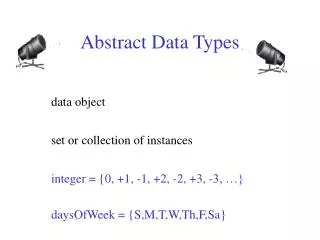
Limitation of PCA • PCA can provide useful projection directions • But can’t “see everything”… • Reason: • PCA finds dir’ns of maximal variation • Which may obscure interesting structure
Yeast Cell Cycle Data • “Gene Expression”– Micro-array data • Data (after major preprocessing): Expression “level” of: • thousands of genes (d ~ 1,000s) • but only dozens of “cases” (n ~ 10s) • Interesting statistical issue: High Dimension Low Sample Size data (HDLSS)
Yeast Cell Cycle Data Data from: Spellman, P. T., Sherlock, G., Zhang, M.Q., Iyer, V.R., Anders, K., Eisen, M.B., Brown, P.O., Botstein, D. and Futcher, B. (1998), “Comprehensive Identification of Cell Cycle-regulated Genes of the Yeast Saccharomyces cerevisiae by Microarray Hybridization”, Molecular Biology of the Cell, 9, 3273-3297.
Yeast Cell Cycle Data Analysis here is from: Zhao, X., Marron, J.S. and Wells, M.T. (2004) The Functional Data View of Longitudinal Data, Statistica Sinica, 14, 789-808
Yeast Cell Cycle Data • Lab experiment: • Chemically “synchronize cell cycles”, of yeast cells • Do cDNA micro-arrays over time • Used 18 time points, over “about 2 cell cycles” • Studied 4,489 genes (whole genome) • Time series view of data: 4,489 time series of length 18 • Functional Data View: 4,489 “curves”
Yeast Cell Cycle Data, FDA View Central question: Which genes are “periodic” over 2 cell cycles?
Yeast Cell Cycle Data, FDA View Periodic genes? Naïve approach: Simple PCA
Yeast Cell Cycle Data, FDA View • Central question: which genes are “periodic” over 2 cell cycles? • Naïve approach: Simple PCA • No apparent (2 cycle) periodic structure? • Eigenvalues suggest large amount of “variation” • PCA finds “directions of maximal variation” • Often, but not always, same as “interesting directions” • Here need better approach to study periodicities
Yeast Cell Cycles, Freq. 2 Proj. PCA on Freq. 2 Periodic Component Of Data
Yeast Cell Cycles, Freq. 2 Proj. PCA on periodic component of data • Hard to see periodicities in raw data • But very clear in PC1 (~sin) and PC2 (~cos) • PC1 and PC2 explain 65% of variation (see residuals) • Recall linear combos of sin and cos capture “phase” • since:
Frequency 2 Analysis • Important features of data appear only at frequency 2, • Hence project data onto 2-dim space of sin and cos (freq. 2) • Useful view: scatterplot
Frequency 2 Analysis • Project data onto 2-dim space of sin and cos (freq. 2) • Useful view: scatterplot • Angle (in polar coordinates) shows phase • Colors: Spellman’s cell cycle phase classification • Black was labeled “not periodic” • Within class phases approx’ly same, but notable differences • Later will try to improve “phase classification”
Batch and Source Adjustment • For Stanford Breast Cancer Data • Analysis in Benito, et al (2004) Bioinformatics https://genome.unc.edu/pubsup/dwd/ • Adjust for Source Effects • Different sources of mRNA • Adjust for Batch Effects • Arrays fabricated at different times
Idea Behind Adjustment • Find “direction” from one to other • Shift data along that direction • Details of DWD Direction developed later