Download
1 / 18
180 likes | 298 Vues
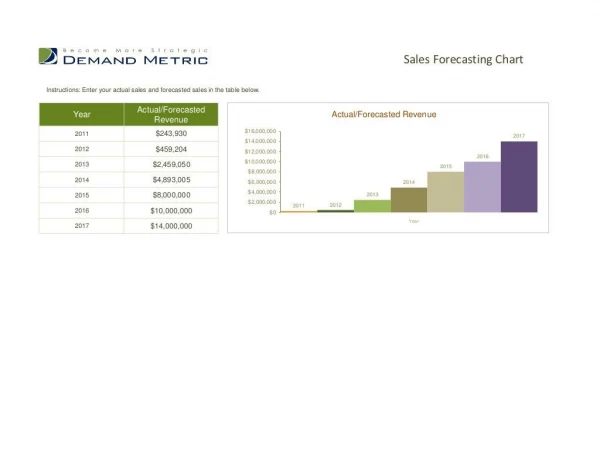
In this project, intern Bo Anderson explores the complexities of sales forecasting at Crescent Electric. By analyzing external economic factors and their correlation with sales, the project aims to identify key variables influencing sales trends. Key methodologies include linear regression to measure relationships between independent and dependent variables, and adjustments for seasonality and branch size. The model achieves a 95% accuracy within a 3% margin. Understanding these relationships is crucial for effective sales strategy and planning.

E N D
Crescent Electric Sales Forecasting A Summer Project by Intern Bo Anderson www.cesco.com
How do you Forecast Sales? • Find variables outside company related to sales • Outside company, economic factors • Measure effect of variables on sales • So X is ↑, do sales go ↑ or ↓? • Adjust for company • Seasonality • Size of company (branches)
How do you find those variables? • Find ones that make logical sense • Find ones that trend with sales • Correlation • “the degree to which two or more attributes or measurements on the same group of elements show a tendency to vary together”
Correlation Types • Positive Correlation • If one thing goes up/down, so does the other • My weight goes up and so does my waist size. • Negative Correlation • If one thing goes up/down, the other does the opposite • I spend more time playing video games and my GPA goes down • No Correlation • If one thing goes up/down, the other doesn’t respond • I eat more cheetos but my shoe size stays the same
Correlation Examples Hypothetical Examples Left Shoe & Right Shoe Correlation = 1.0 # of Apples Person 1 & Person 2 if sharing Correlation = -1.0 Real Life Examples Unemployment Rate & # of Hires Correlation = -0.93 MLB 2011: Wins & Saves Correlation = -0.03
Regression • Linear Regression: • the relation between variables in an equation that measures how certain independent variables effect a dependent variable • Measure the effect of variables while holding “everything else constant” • Hand size & weight relationship, really it’s just height and weight • Must hold height constant to really see a relationship
Let’s do our own Linear Regression What is the relationship between the Economy and Crescent’s Total Sales?
Real Private Nonresidental Investment • Measured in billions of 2005 dollars. This means it’s adjusted for inflation • Measures business investment purchases (buildings, inventory etc.) • The majority of our sales count under this
Real Personal Income Excluding Current Transfer Receipts • Measured in Billions of 2005 Dollars, meaning adjusted for inflation • Measures individuals ability to consume • Our customers livelyhood
# of Branches • Measured in… well branches. Closings and openings are adjusted by the year/quarter of change so decimals are used (Close in late June then .5 branches for year) • Help measure an increase in our available market
S&P Case-Shiller 20-City Home Price Index • Index with January of 2000 as a base of 100 • Increase in demand for a housing, means increases in complimentary products (ex: lights, wiring, etc.) • Type 1 Customers are effected by housing
All Employees: Goods Producing Industries • Measured in thousands of persons • As companies expand payrolls they’ll also be in a position to expand inventories and builidings
Our Model • Q1 Sales = - $35,2464,272.30 + ($46,758.22)*RPNFI + ($55,242.36)*SPCSHHPI + ($7,492.30)*AEGPI + ($32,962.60)*RPIECTR + ()*BranchesSeasonal Adjustments: Q2 + $29,606,440.82; Q3 + $36,307,769.30; Q4 + $29,550,914.42
How accurate is our Model? • 95% of the time it is within 3%. Once every 20 years it will be off by more • The odds of it being off are the same as the odds the Dallas Cowboys have to win the Super Bowl this year according to Vegas • Think about it the Cowyboys COULD win the Super Bowl, but we are pretty sure that won’t happen. if anybody wants to bet heads-up with 1 to 1 odds, I’ll take your bet right now