Forecasting New Product Sales & Development Notes
280 likes | 422 Vues
Learn about forecasting sales for new products, essential for product development. Discover key factors and models for accurate sales projections.

Forecasting New Product Sales & Development Notes
E N D
Presentation Transcript
Forecasting New Product Sales Notes for Product Development Roger Bohn Material from various sources including mktgweb.wharton.upenn.edu/hutch/RWWI-HDTV.PPT See also: New Products Management by Crawford & di Benedetto Rev: Nov. 6 2013
Schedule of remaining classes • Today Nov. 6: Market penetration modeling. Reading posted on the web. • Wed. Nov 13 Milestone: Design review. Concept testing and Design for Manufacturability (if time) Read: Chapters 9, chapter 13 • Mon Nov. 18 Industrial design (Donald Norman Design of Everyday Things) • Wed. Nov. 20 Milestone: Final prototype • Mon Nov. 25 Studying old presentations; how to make an effective pitch. • Wed. Nov. 27 or Sunday Dec. 1 Presentation rehearsals (90 minutes per team) • Mon. Dec. 2 The Mythical Man Month (no preparation needed, but book is good) • Tues. Night of Dec. 3: Milestone: Final presentations • Wed. Dec 4: Identifying weak areas to improve for the business plan/final report • Friday Dec 6 Milestone: Business plan due • Wed. Dec 14 Milestone: Case studies due.
Key inputs each quarter • Sales volume (physical units) Q(t) • Size of market • Market share (t) • Penetration curve (t) • ASP at factory gate P • Manufacturing costs = C(Q) • Development costs, duration • Discount rate
Typical Diffusion Curves:Cumulative Penetration CUMULATIVE PENETRATION SOURCE: Best (1997), Market-Based Management
Target users don’t know. If they know they might not tell us. Poor execution of market research. Market dynamics. Uncertainties about marketing support. Biased internal attitudes. Poor accounting. Rushing products to market. Basing forecasts on history. Technology revolutions. Why Financial Analysis for New Products is Difficult
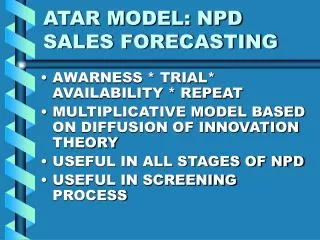
Steady state models: ultimate market share ATAR Dynamic models: adoption over time “Diffusion of innovation” Social level: new type of product Curve-fitting to actual patterns Multi-generation models How fast does new tech replace old equivalent? Ecosystem models? Three types of sales models (at least)
MS = T x R x Aware x Available Sales = Market size x MS = (# users) x (purchase rate per yr) MS = market share T = percent of “all buyers” who try product R = long run repeat rate 1. Steady state: established non-durables (ATAR)
A-T-A-R Model of Figure 8.5 Units Sold = Number of buying units x % Aware of product x % who would Try product if they can get it x % to whom product is Available x % of triers who become Repeat purchasers x Number of units each customer buys in a year Sales = Market size x Market Share = (# users) x (purchase rate per yr)
The A-T-A-R Model: Definitions Figure 8.6 • Buying Unit: Purchase point (person or department/buying center). • Aware: Has heard about the new product with some characteristic that differentiates it. • Available: If the buyer wants to try the product, the effort to find it will be successful (expressed as a percentage). • Trial: Usually means a purchase or consumption of the product. • Repeat: The product is bought at least once more
Getting the Estimates for A-T-A-R Model Figure 8.7 xx: Best source for that item. x: Some knowledge gained.
likelihood of "spontaneous" innovation likelihood of "imitation" or "contagion" remaining market potential 2. Diffusion models(population adoption of innovation) New Adopters = (i.e., first purchases) [ p + q x (Old Adopters/Population) ] x [Population - Old Adopters] • Based on models of contagious diseases, the Bass (1969) model of the diffusion of innovation has proved to be a simple & robust model of product life cycles. Average Diffusion Curves 100% 80% First Purchases 60% Repeat = 20% Repeat = 50% 40% Repeat = 100% 20% 0% Time Total users(T) = (new adopters(t) x repeat purchasers)
Average Diffusion Curves 100% S-shaped Diffusion Curves 100% 80% 80% 60% 60% 40% 40% 20% 20% 0% Time 0% Time Diffusion is faster when: 1. marketing expenditures are high, 2. competitive activity is high and products use similar technologies (why?) 3. the innovation is simple, low risk, easy to observe, easy to try, 4. it is compatible with consumer knowledge and social values, 5. it has a clear relative advantage.
Average Diffusion Curves 100% 80% 60% 40% 20% 0% Time Growth of your market share New product in established market: 1. Diffusion curves still relevant, but top is your steady state share eg 12% 2. Parameters of curve depend on: • number of competitors • relative marketing campaigns; • marketing strategy eg pull vs push • Of course, world never reaches steady state (equilibrium = a useful economic fiction)
Meta-Analysis of Diffusion Curves Meta-Analysis of 213 Product Innovations 100.0% 90.0% 80.0% 70.0% 60.0% 50.0% Market Penetration (i.e., Cumulative Adoption) 40.0% 30.0% 20.0% 10.0% 0.0% 1 3 5 7 9 11 13 15 17 19 21 23 Years Medical & Industrial Consumer Durables Average 4.6% 3.9% 2.3% innovation coefficient = 58.5% 30.2% 24.0% imitation coefficient = .16 .11 .07 rate = .28 .36 .31 shape = SOURCE: Sultan, Farley & Lehmann (1990), Journal of Marketing Research
3. Multi-Generational Diffusion Curves:Annual Sales of DRAM Memory Chips Six Generations of Dynamic RAM SOURCE: Best (1997), Market-Based Management
What drives diffusion/adoption of an innovation ? • Spontaneous Adoption Individuals adopt on the basis of their personal needs and marketing activities without regard to cumulative penetration (e.g. VOIP). -- classic marketing • Contagion or Imitation* Individuals become more likely to adopt the innovation as cumulative penetration increases because their observation of prior adopters and word-of-mouth information is important in their decision making (e.g., personal digital assistants). -- “word of mouth”, market pull • Direct Network Externalities** Individuals become more likely to adopt the innovation as cumulative penetration increases because: the value of the innovation to each adopter increases as the number of adopters increases (e.g., fax machines) -- niche markets; standards battles • Indirect Network Externalities** Individuals become more likely to adopt the innovation as cumulative penetration increases because the value of the innovation to the adopter depends on the availability of complementary products and the providers of these products respond to increasing demand (e.g., HDTV; MM PCs; BB internet) -- market to software makers; standards battles Marketing approach differs for each
most products initially show increasing sales marketing efforts and trial purchase may cause quick growth regardless of long-run diffusion Few data points First Purchases Repeat = 20% Repeat = 50% Repeat = 100% Average Diffusion Curves Concave (and Rapid) Diffusion S-shaped (and Slow) Diffusion Curves 100% 100% 100% 80% 80% 80% 60% 60% 60% 40% 40% 40% 20% 20% 20% 0% 0% 0% Time Time Time HOWEVER, diffusion curves are difficult to predict prior and just after launch
Direct and Indirect Network Externalities MANUFACTURERS (Supply Hardware) Market-Mediated Interdependence Direct Demand Dependence Direct Demand Dependence COMPLEMENTORS (Supply Software, Content, & Ancillary Services) CONSUMERS (Demand Whole Product)
Is forecasting impossible? • For genuine revolutions, yes • But 99% of “revolutionary” products are similar to predecessors • Gather early data to pin down model • Which model best fits? • Similar historical products • Model parameters • Concept testing
Background: Industry, process description, key success factors (why learn? About what?) Case A: Methods of learning May be historical, or present. Usually several complementary methods, 1-2 of which are your focus Analyze: Strengths, weaknesses, etc. What it’s good for; not good for; attributes like cost Underlying changes: is target static, or dynamic? Case B: Revised method What it is; how it differs strengths/weaknesses by comparison Effects on rate of learning (claimed and actual) Analysis How to learn even faster (opportunities) How competitors/adversaries respond predictions “Standard paper template”