Download
1 / 18
220 likes | 389 Vues
Reliability of Measurements. Chapter 2.3. Objectives. I can define and compare accuracy and precision . I can calculate percent error to describe the accuracy of experimental data. I can use significant figures and rounding to reflect the certainty of data. Accuracy and Precision.

E N D
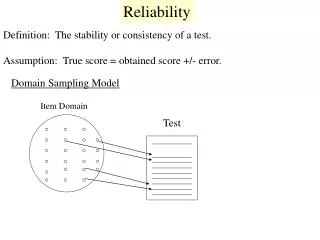
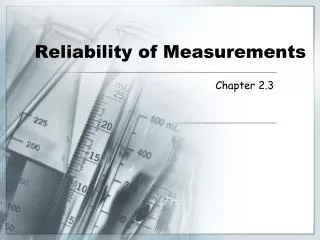
Reliability of Measurements Chapter 2.3
Objectives • I can define and compare accuracy and precision. • I can calculate percent error to describe the accuracy of experimental data. • I can use significant figures and rounding to reflect the certainty of data.
Accuracy and Precision Often accuracy and precision are confused for one another, but they are different concepts.
Accuracy and Precision What are the precision and accuracy levels of the following? Low Accuracy High Precision High Accuracy High Precision Low Accuracy Low Precision
Whose data is most accurate/precise? Three chemistry students measured the mass and volume of a piece of zinc to determine it’s density. The table below shows the data: Compare the students data. Whose data is the most accurate and precise?
Percent Error A way to evaluate the accuracy of data. Percent Error = Ratio of the error to the accepted value │Accepted value – Measured value│ Accepted value × 100%
125.0 mL – 123.4 mL 1.6 mL ________________________________________ _______________ 125.0 mL 125.0 mL = = 1.3% X 100% Percent Error If your measurement of a liquid is 123.4 mL but the actual amount is 125.0 mL, what is the percent error of the measurement?
How much water is in this graduated cylinder? • 52 mL? • 53 mL? • 54 mL? • 52.8 mL • Sig figs- all the digits that are known in a measurement plus one that is estimated.
Significant Figures • The number of digits reported in a measurement. • All the known digits plus one estimated value. • The number of significant figures possible depends upon the piece of equipment used to take the measurement.
Rules for Significant Figures • Non-zero numbers are always significant. (1-9) • Zeros between non-zeros are always significant. (2013.5) • All final zeros to the rightof the decimal place are significant. (5.50) • Zeros that act as placeholders are NOT significant. (3000 or 0.0036) • Counting numbers and defined constants have an infinite number of significant figures.
Determine the number of sig figs in the following numbers. Red numbers=significantBlack numbers=not significant Practicing Significant Figures • 0.02 • 70001 • 5600 • 4.100 • 3.1416 (p) • 2.80 x 10⁵ 0.02 70001 5600 4.100 3.1416 (p) 2.80 x 10⁵ 1 5 2 4 Infinite 3
Rules for Rounding If the digit to the immediate right of the last sig fig is 5-9, round up. If not, leave as is.
Significant Figures and Calculators When using a calculator, you should do the calculation using the digits allowed by the calculator and round off only at the end of the problem. Do NOT round off in the middle of the problem!
Sig Figs and Addition/Subtraction + - + - + - + - + - + - + - + When you add or subtract, you answer must have the same number of digits to the right of the decimal point as the original value with the fewest digits to the right of the decimal place. + - + - + - + - + - + - + - +
Sig Figs and Multiplication/Division When you multiply or divide, your answer must have the same number of significant figures as the original value with the least significant figures.
Practicing Significant Figures 3.33 m2 25 m 53 mL 26.6 g 6.7 cm3