Download
1 / 1
10 likes | 117 Vues
National Taiwan University. (A). (A). (B). y = 162.78x + 13483 R 2 = 0.8026. y = 1857.5x + 2401.4 R 2 = 0.5234. (B). Introduction

E N D
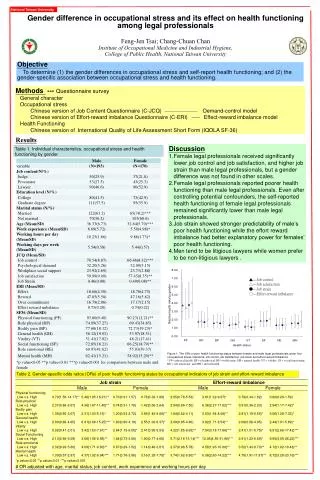
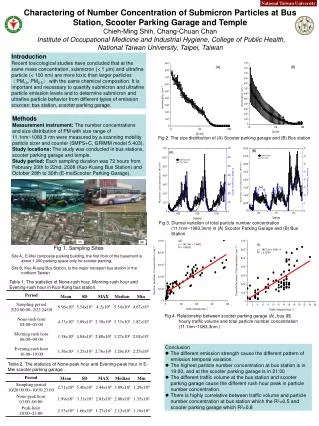
National Taiwan University (A) (A) (B) y = 162.78x + 13483 R2= 0.8026 y = 1857.5x + 2401.4 R2 = 0.5234 (B) Introduction Recent toxicological studies have concluded that at the same mass concentration, submicron (< 1 μm) and ultrafine particle (< 100 nm) are more toxic than larger particles(PM10, PM2.5) with the same chemical composition. It is important and necessary to quantify submicron and ultrafine particle emission levels and to determine submicron and ultrafine particle behavior from different types of emission sources: bus station, scooter parking garage. (A) (B) Charactering of Number Concentration of Submicron Particles at Bus Station, Scooter Parking Garage and TempleChieh-Ming Shih, Chang-Chuan ChanInstitute of Occupational Medicine and Industrial Hygiene, College of Public Health, National Taiwan University, Taipei, Taiwan Methods Measurement instrument: The number concentrations and size distribution of PM with size range of 11.1nm~1083.3 nm were measured by a scanning mobility particle sizer and counter (SMPS+C, GRIMM model 5.403). Study locations: The study was conducted in bus stations, scooter parking garage and temple. Study period: Each sampling duration was 72 hours from February 20th to 22nd, 2008 (Kuo-Kuang Bus Station) and October 28th to 30th (E-meiScooter Parking Garage). Fig 2. The size distribution of (A) Scooter parking garage and (B) Bus station (B) (A) Fig 3. Diurnal variation of total particle number concentration (11.1nm~1083.3nm) in (A) Scooter Parking Garage and (B) Bus Station Fig 1. Sampling Sites Site A,. E-Mei composite parking building, the first floor of the basement is about 1,000 parking space only for scooter parking. Site B, Kuo-Kuang Bus Station, is the major transport bus station in the northern Taiwan Table 1. The statistics of None-rush hour, Morning-rush hour and Evening-rush hour in Kuo-Kung bus station. Fig 4. Relationship between scooter parking garage (A), bus (B) hourly traffic volume and total particle number concentration (11.1nm~1083.3nm ) • Conclusion • The different emission strength cause the different pattern of emission temporal variation. • The highest particle number concentration at bus station is in 19:00, and at the scooter parking garage is in 21:00 • The different traffic volume at the bus station and scooter parking garage cause the different rush hour peak in particle number concentration. • There is highly correlative between traffic volume and particle number concentration at bus station which the R2=0.5 and scooter parking garage which R2=0.8 Table 2. The statistics of None-peak hour and Evening-peak hour in E-Mei scooter parking garage..