Download
1 / 26
260 likes | 400 Vues
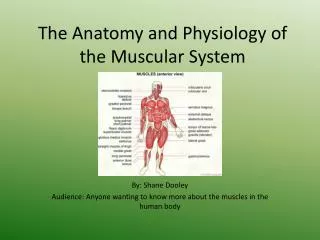
Muscular Histology and Physiology. Photomicrograph of the capillary network surrounding skeletal muscle fibers. Microscopic anatomy of a skeletal muscle fiber. Nuclei. Fiber. (a). Sarcolemma. Mitochondrion. Myofibril. Dark A band. Light I band. Nucleus. (b). Z disc. H zone.

E N D
Photomicrograph of the capillary network surrounding skeletal muscle fibers
Microscopic anatomy of a skeletal muscle fiber Nuclei Fiber (a) Sarcolemma Mitochondrion Myofibril Dark A band Light I band Nucleus (b) Z disc H zone Z disc Thin (actin) filament Thick (myosin) filament (c)
Composition of thick and thin filaments Thick filament Thin filament Tail Heads Flexible hinge region (a) Myosin molecule (d) Longitudinal section of filaments within one sarcomere of a myofibril Thin filament (actin) Myosin heads Thick filament (myosin) Myosin head (b) Portion of a thick filament Troponin complex Tropomyosin Actin (c) Portion of a thin filament (e) Transmission electron micrograph of part of a sarcomere
Microscopic anatomy of a skeletal muscle fiber Z disc H zone Z disc Thin (actin) filament Thick (myosin) filament (c) I band A band I band M line Sarcomere M line Z disc Z disc Thin (actin) filament Elastic (titin) filaments Thick (myosin) filament (d) I band thin filaments only H zone thick filaments only M line thick filaments linked by accessory proteins Outer edge of A band thick and thin filaments overlap (e)
Relationship of the sarcoplasmic reticulum and T tubules to myofibrils of skeletal muscle I band A band I band Z disc H zone Z disc M line Part of a skeletal muscle fiber (cell) Sarcolemma Triad Mitochondrion Myofibrils Myofibril Tubules of sarcoplasmic reticulum Sarcolemma Terminal cisterna of the sarcoplasmic reticulum T tubule
Sliding filament model of contraction Z Z H A I I 1 Z Z A 3 Z Z A 2
Connective tissue sheaths of skeletal muscle Epimysium Tendon Muscle fiber in middle of a fascicle Epimysium Endomysium (between fibers) Endomysium (b) Perimysium Blood vessel Muscle fiber (cell) Bone (a) Perimysium Endomysium Blood vessel Fascicle (wrapped by perimysium)
The neuromuscular junction Myelinated axon of motor neuron Action potential Axon terminal at neuromuscular junction Sarcolemma of the muscle fiber Nucleus (a) Axon terminal Axon terminal of a motor neuron Fusing synaptic vesicle Mitochondrion ACh molecules Synaptic vesicle Ca2+ Acetic acid Synaptic cleft T tubule Choline Synaptic cleft Junctional folds of the sarcolemma at motor end plate Acetylcholinesterase K+ Na+ Binding of Ach to receptor opens Na+/K+ channel Part of a myofibril (c) (b)
Figure 9.7a: The neuromuscular junction, p. 290. Myelinated axon of motor neuron Action potential Axon terminal at neuromuscular junction Sarcolemma of the muscle fiber Nucleus (a)
The neuromuscular junction Axon terminal of a motor neuron Mitochondrion Synaptic vesicle Ca2+ Synaptic cleft T tubule Junctional folds of the sarcolemma at motor end plate Part of a myofibril (b)
The neuromuscular junction Axon terminal Fusing synaptic vesicle ACh molecules Acetic acid Choline Synaptic cleft Acetylcholinesterase K+ Na+ Binding of Ach to receptor opens Na+/K+ channel (c)
An action potential in a skeletal muscle fiber [Na+] [K+] (a) Electrical conditions of a resting (polarized) sarcolemma. The outside face is positive, while the inside face is negative. The predominant extracellular ion is sodium (Na+); the predominant intracellular ion is potassium (K+). The sarcolemma is relatively impermeable to both ions. [K+] [Na+] (a) (b) Step 1: Depolarization and generation of the action potential. Production of an end plate potential at the motor end plate causes adjacent areas of the sarcolemma to become permeable to sodium (voltage-gated sodium channels open). As sodium ions diffuse rapidly into the cell, the resting potential is decreased (i.e., depolarization occurs). If the stimulus is strong enough, an action potential is initiated. Na+ Stimulus (b) (c) Step 2: Propagation of the action potential. The positive charge inside the initial patch of sarcolemma changes the permeability of an adjacent patch, opening voltage- gated Na+ channels there. Consequently the membrane potential in that region decreases and depolarization occurs there as well. Thus, the action potential travels rapidly over the entire sarcolemma. (c) (d) Step 3: Repolarization. Immediately after the depolarization wave passes, the sarcolemma's permeability changes once again: Na+ channels close and K+ channels open, allowing K+ to diffuse from the cell. This restores the electrical conditions of the resting (polarized) state. Repolarization occurs in the same direction as depolarization, and must occur before the muscle fiber can be stimulated again. The ionic concentrations of the resting state are restored later by the sodium-potassium pump K+ (d)
Action potential scan showing changing sarcolemma permeability to Na+ and K+ ions Na+ channels close Action potential +30 K+ channels open 0 Membrane potential (mV) Relative membrane permeability Na+ channels open Threshold –55 –70 0 1 2 3 4 Time (ms)
Excitation-contraction coupling Neurotransmitter released diffuses across the synaptic cleft and attaches to ACh Axon terminal Synaptic cleft Synapticvesicle Sarcolemma T tubule 1 Net entry of Na+ initiates an action potential which is propagated along the sarcolemma and down the T tubules. ACh ACh ACh Ca2+ Ca2+ SR tubules (cut) SR 2 Action potential in T tubule activates voltage-sensitive receptors, which in turn trigger Ca2+ release from terminal cisternae of SR into cytosol. Ca2+ Ca2+ ADP Pi Ca2+ Ca2+ Ca2+ Ca2+ 6 Tropomyosin blockage restored, blocking myosin binding sites onactin; contraction ends and muscle fiber relaxes. 3 Calcium ions bind to troponin; troponin changes shape, removing the blocking action of tropomyosin; actin active sites exposed. Ca2+ Removal of Ca2+ by active transport into the SR after the action potential ends. 5 Ca2+ 4 Contraction; myosin heads alternately attach to actin and detach, pulling the actin filaments toward the center of the sarcomere; release of energy by ATP hydrolysis powers the cycling process.
Role of ionic calcium in the contraction mechanism Overview Actin Troponin Myosin head Tropomyosin Plane of (d) Plane of (a) Additional calcium ions bind to TnC TnT Myosin binding site Tropomyosin TnC Tnl Myosin binding sites Actin + Ca2+ Actin Additional calcium ions bind Troponin complex Myosin head Myosin head (a) (d) (b) (c)
The cross bridge cycle ADP Myosin head (high-energy configuration) Pi 1 Myosin head attaches to the actin myofilament, forming a cross bridge. Thin filament ADP ADP ATP hydrolysis Thick filament Pi Inorganic phosphate (Pi) generated in theprevious contraction cycle is released, initiating the power (working) stroke. The myosin head pivots and bends as it pulls on the actin filament, sliding it toward the M line. Then ADP is released. 2 As ATP is split into ADP and Pi, the myosin head is energized (cocked into the high-energy conformation). 4 ATP Myosin head (low-energy configuration) ATP As new ATP attaches to the myosin head, the link between Myosin and actin weakens, and the cross bridge detaches. 3
, p. 296. Spinal cord Motor unit 1 Motor unit 2 Axon terminals at neuromuscular junctions Nerve Motor neuron cell body Motor neuron axon Muscle Muscle fibers Muscle fibers Branching axon to motor unit (a) (b)
The muscle twitch Latent period Latent period Period of contraction Period of relaxation Extraocular muscle (lateral rectus) Gastrocnemius Soleus Percentage of maximum tension Percentage of maximum tension 0 0 20 40 60 80 100 120 140 0 0 40 80 120 160 200 Single stimulus Single stimulus Time (ms) Time (ms) (a) (b)
Methods of regenerating ATP during muscle activity Glucose (from glycogen breakdown or delivered from blood) Glucose (from glycogen breakdown or delivered from blood) O2 CP ADP Glycolysis in cytosol Pyruvic acid Fatty acids O2 O2 Aerobic respiration in mitochondria Amino acids ATP 2 ATP Creatine Pyruvic acid net gain O2 ATP 38 CO2 Released to blood Lactic acid H2O net gain per glucose (a) Direct phosphorylation [coupled reaction of creatine phosphate (CP) and ADP] (b) Anaerobic mechanism (glycolysis and lactic acid formation) (c) Aerobic mechanism (aerobic cellular respiration) Energy source: CP Energy source: glucose Energy source: glucose; pyruvic acid; free fatty acids from adipose tissue; amino acids from protein catabolism Oxygen use: None Products: 2 ATP per glucose, lactic acid Duration of energy provision: 30–60 s. Oxygen use: Required Products: 38 ATP per glucose, CO2, H2O Duration of energy provision: Hours Oxygen use: None Products: 1 ATP per CP, creatine Duration of energy provision: 15s
Factors influencing force, velocity, and duration of skeletal muscle contraction Large number of muscle fibers activated Large muscle fibers Asynchronous tetanic contractions Muscle and sarcomere length slightly over 100% of resting length Predominance of fast glycolytic (fatigable) fibers Small load Predominance of slow oxidative (fatigue-resistant) fibers (a) Increased contractile force (b) Increased contractile velocity (c) Increased contractile duration
Influence of load on contraction velocity and duration Light load Velocity of shortening Intermediate load Distance shortened Heavy load 0 20 40 60 80 100 120 0 Time (ms) Increasing load Single action potential initiated (b) (a)
Innervation of smooth muscle Mucosa Smooth muscle cell Varicosities Autonomic nerve fiber Submucosa Serosa Muscularis externa Varicosity Mitochondrion Synaptic vesicles
Sequence of events in excitation-contraction coupling of smooth muscle Extracellular fluid Ca2+ Plasma membrane Cytoplasm Calcium ions (Ca2+) enter the cytosol from the ECF or from the scant SR. 1 Ca2+ Ca2+ binds to and activates calmodulin. 2 Sarcoplasmic reticulum Ca2+ Activated calmodulin Inactive calmodulin Activated calmodulin activates the myosin light chain kinase enzymes. 3 Activated Inactive kinase kinase The activated kinase enzyme catalyzes transfer of phosphate to myosin heads, activating the myosin head ATPases. 4 ATP ADP Pi Pi Activated (phosphorylated) myosin molecule Inactive myosin molecule Thin myofilament Pi Phosphorylated myosin heads form cross bridges with actin of the thin filaments and shortening occurs. 5 Thick filament Pi Cross bridge activity ends when phosphate is removed from the myosin heads by phosphorylase enzymes and intracellular Ca2+ levels fall. 6