Introduction to Financial Modeling for Efficient Fund Flow System Organization
210 likes | 232 Vues
Learn how to design a financial model for a regional company, manage assumptions, analyze cash flow, and calculate key financial ratios. Discover useful tips and avoid common mistakes for accurate projections. Follow step-by-step guidelines to develop a comprehensive financial projection.

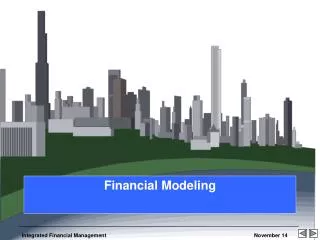
Introduction to Financial Modeling for Efficient Fund Flow System Organization
E N D
Presentation Transcript
The Modeler’s Key Objective is to Best Reproduce the Utilities Fund Flow System
Organization • Reduces the Madness!!
How I Organize Models • Title • Dashboard • Project Data Sheet • Opening Balance Sheet • Management Assumptions • Demand, Production & Operations • Investment (CAPEX) Program • Financing Options • Output Statements • Movement of Accounts • Rate of Return Calculations
The Dashboard • Extremely useful schedule as it allows to view a summary of indicators and carry out simulations directly. • Should include: • Demographic data • Average tariffs • Key performance indicators • Financing Options & Results • Cash flow Results • Project probability indicators • Projected key indicators
Waterfall Cash Flow 1st Priority • The waterfall format allows the financial analyst to review the cash position according to financial management priorities. • A financial cashflow solution is derived only if the yellow line is zero. 2nd Priority 3rd Priority 4th Priority 5th Priority
Useful Tips • Instead of putting all the assumptions on one sheets, apply assumptions where they are most needed for review and use a Dashboard. • Be methodical and make full use of the required steps. • Color code inputs values and key variables and lock formula cells, especially if used by third party. • All statements should be protected. • Statements and schedules should all be on the same columns. • Data availability should drive the complexity of the model. • If formulas are overly complex, divide into steps.
Common Mistakes • The model becomes the End Goal, not the financial results. • The model tries to do too many things, tariff structure, trend analysis, volume forecasts, demand elasticity. Develop separate subsidiary models. • Not properly organized. • Cutting corners. • Detailed breakdown/elaboration on non material variables. • Requiring inordinate amounts of data. • Add historical presentation to projections • Investment period should be no longer than 5-years (7 for hydropower). • Projection period should be no more than 25 years. • Escalating revenues with expenses. • Accumulating cash or negative cash balances. • Linking to other workbooks.
Steps for Developing a Financial Projection • Step 1: Assess data information accessibility of WSS entity. • Step 2: Determine key indicators that require focus. Use the Audit Reports. • Step 3: Populate Opening Balance Sheet Position from most current audit report • Step 4: Determine which Balance Sheet Accounts that are immaterial and do not require movement • Step 5: Determine Financial Management Parameters by calculating historical ratios. Check balance sheet accounts in first year projection against historical values. Recalibrate if material difference. • Step 6: Work with WSP to develop complete 5-year investment program and new financing sources and terms. Develop amortization of existing loans associated with balance sheets balances. • Step 7: Develop detailed schedule for WSS production, sales and revenues and OPEX. This is the most custom worksheets. Key technical parameters need to coincide with investment program. • Step 8: Develop base projection in constant costs and check results: (i) annual cash flow positions by priority, (ii) movements of balance sheet accounts; (iii) statistical indicators. • Step 9: Perform Tariff Adequacy analysis • Step 10: Make modifications if necessary and finalize • Step 11: Review with management for buy-in and to various technical and management assumptions. • Step 12: Develop a list of agreed action items for monitoring during project implementation.