Download

1 / 11
110 likes | 155 Vues
Explore the world of Monte Carlo simulation, a virtual experience to model complex situations, dealing with uncertainty and enhancing decision-making. Understand key points, simulation models, distributions, Crystal Ball software, and conduct sensitivity analysis. Learn to run simulations via Crystal Ball, interpret outcomes, and make informed decisions. Dive into the realm of modeling for better forecasting and risk analysis.

E N D
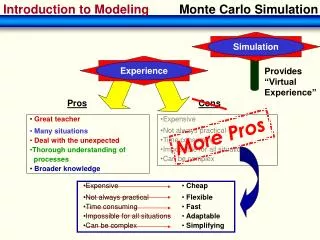
Introduction to Modeling Monte Carlo Simulation Experience Simulation Pros Cons Provides “Virtual Experience” • Great teacher • Many situations • Deal with the unexpected • Thorough understanding of processes • Broader knowledge • Expensive • Not always practical • Time consuming • Impossible for all situations • Can be complex More Pros • Expensive • Not always practical • Time consuming • Impossible for all situations • Can be complex • Cheap • Flexible • Fast • Adaptable • Simplifying
Introduction to Modeling Monte Carlo Simulation Key Points of Simulation Models • Allow for interactivity and experimentation by the modeler • Generates a range of possibilities from criteria given rather than optimizing the goal • Applicable to short run, temporary and specific behaviorAnalytic (statistical) models predict average, or steady state, long run behavior • Deals well with uncertainty • Can deal with ‘complicating factors’ that make analytical modeling difficult or impossible to estimate: uncertainty, risk, multiple locations, volatile sales • Inexpensive,relatively simple process using software like Excel and Crystal Ball
Introduction to Modeling Monte Carlo Simulation Monte Carlo Simulation - named for the roulette wheels of Monte Carlo As in roulette, variable values are known with uncertainty Unlike roulette, specific probability distributions define the range of outcomes Crystal Ball - an application specializing in Monte Carlo simulation
Introduction to Modeling Monte Carlo Simulation Normal Distribution Generating Random Variables CRYSTAL BALL: • Generates random variables across a distribution specified by the user • Lets users select distributions from a gallery or generate their own • Generates a report containing all of the model’s assumptions EXAMPLE: Normal Distribution of random variables having a mean value of 3.0 generated by the equation is X2
Introduction to Modeling Monte Carlo Simulation Uniform Distribution Triangle Distribution Custom Distribution Lognormal Distribution Generating Other Distributions
Introduction to Modeling Monte Carlo Simulation • The User • Defines distribution assumptions • Selects the number of trials • Sets the forecast variables • Crystal Ball • Repeats the simulation for the predetermined number of trials • Calculates forecast values for each trial • Reports the results Monte Carlo Simulation Via Crystal Ball 1) Specify the model’s equation(s) 2) Define the variable distributions 3) Define the forecasts 4) Select number of trials 5) Run the Monte Carlo Simulation 6) Interpret the results 7) Make decisions
Introduction to Modeling Monte Carlo Simulation Outcome Frequency Chart - Normal Distribution Outcome Frequency Chart - Lognormal Distribution Distribution of Outcomes Distribution of outcomes depends on the distributions chosen for the assumption variables
Introduction to Modeling Monte Carlo Simulation Sensitivity Analysis and Risk One of Crystal Ball’s best features: it can easily and quickly perform sensitivity and risk analysis. Goal: Determine the likelihood that, given the normal distribution used, the result will equal at least1. Result: Drag the arrow to where the frequency chart equals 1 and the probability will be calculated by Crystal Ball.
Introduction to Modeling Monte Carlo Simulation Sensitivity Analysis and Risk Probability that the result will equal at least 1 is 53.60%
Introduction to Modeling Break-Even Simulation
Introduction to Modeling Decision Tree Simulation