Download
1 / 20
200 likes | 212 Vues
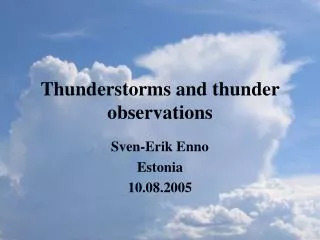
Southern Thunder Alliance brings together total lightning data and product producers to collaborate and advance scientific understanding of thunderstorm processes. Develop and evaluate nowcasting/short-term forecasting and warning decision-making applications that use total lightning.

E N D
Southern Thunder Alliance and LMA Assessments Steve Goodman and Dennis Buechler
Bring total lightning data and product producers together with the product and decision-making consumers Form collaborations to advance scientific understanding of thunderstorm processes Develop and evaluate nowcasting/short-term forecasting and warning decision-making applications that use total lightning in an operational environment Southern Thunder Alliance
NASA-NOAA-University-Industry Partners SPoRT Center (NASA MSFC/NSSTC) New Mexico Tech and other universities OU/NSSL Vaisala, Inc. WFOs – Huntsville (HUN), Nashville (OHX), Birmingham (BMX), Fort Worth (FDW), Melbourne (MLB), Norman (OUN) All LMA systems located in NWS Southern Region North Alabama OU/NSSL New Mexico Tech Langmuir Laboratory White Sands Missile Range KSC/CCAFS (LDAR) TAMU (LDAR II) Dallas/Fort Worth (Vaisala LDAR II) Southern Thunder Alliance
History of LMA data @HUN • First started ingesting LMA data into AWIPS in May 2003 • First case where used to warn: May 6th,2003 • First case used not to warn: August 27,2003 • Building cases for training on WES ~27 cases archived so far • Supported LMA-AWIPS ingest at BMX, OHX, OUN • Supported ingest of Vaisala LDAR II data at FWD History of LMA data @HUN
Ingest into AWIPS AWIPS Workstation Forecaster DS 1 NASA LDAD SRH FTP Server
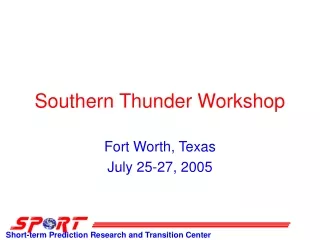
Southern Thunder Workshop #2Fort Worth, Texas 25-27, 2005 Briefings by Researchers (Owner Operators) and Forecasters (End Users) followed by discussion and prioritization of lightning research and applications in 3 subject focus areas Presentations at http://weather.msfc.nasa.gov/sport Focus Areas : • Product Definition and Generation • Lightning Threat Product combining LMA/LDAR and NLDN • Lightning “Top” Product • Flash Extent Density (FED) • Cell Tracking (SCIT) and Trending – FSL FXnet/WDSSII • Detection Efficiency, Performance Metrics, Accuracy • WES Cases, Training and Assessments
WDSSII Display and Interface Vertical Slice Vertical Slice Base Scan Radar 5 km Level LMA • WDSSII LMA source density X-scns, CAPPIs • VILMA 1 min density to AWIPS at OUN, TSA, FWD NSSL/MacGorman, Stumpf
LDAR II Sources (Red) and NLDN Flashes (Black) detected between 0312:30 and 0317:30 UTC 15 June 2001 Fort Worth WSR-88D Base Reflectivity Image from 0315 UTC 15 June 2001 CG lightning hazard Isolated CG Lightning Threat High CG Lightning Threat Vaisala/Demetriades
FED and NLDN at 2114 UTC, 25 April 2005 Vaisala/Demetriades
CG Lightning Hazard ProductCombination Of LDAR II And NLDN Data - Mesoscale Convective System Blue - Total lightning Red - CG lightning
60 min of CG lightning prior to 15:15 Z on 17 Aug 2001 Vaisala/Demetriades
60 min of LDAR II activity prior to 15:15 Z on 17 Aug 2001 Vaisala/Demetriades
Spider flash at 15:15 Z on 17 Aug 2001Lightning warning at DFW was no longer in effect when this occurred Vaisala/Demetriades
Illustration of concept:yellow represents threat area, red is where CGs are currently occurring Vaisala/Demetriades
Experimental Lightning Threat ProductCombining NALMA and NLDN
Southern Thunder Workshop #2Fort Worth, Texas 25-27, 2005 One of the Workshop Recommendations: Due to cancellation of VORTEX-II Experiment in 2007, pursue newly available opportunity to deploy, evaluate, and assess the scientific and technological merits of total lightning mapping with the NMT portable LMA in an additional operational setting. Proposed DC Metro Area Lightning Mapping Demonstration: • Briefing 26 August to NWS Office of Science and Technology and Eastern Region Scientific Services Division • WFO Sterling (LWX) host site, NWS MDL Program Mgr • Endorsement of Director D. L. Johnson, National Weather Service • NWS requesting funds from NESDIS GOES-R • Additional area partners (Howard University, U. Maryland, GSFC)
Severe Storm Reports for the DC Surrounding Area 1999-2004 Severe Reports 235 Tornadoes 3291 SVR Wind 1353 Hail Map of all severe reports received during a 5 year period (12Z 31 Dec 1999 - 12Z 31 Dec 2004) for a region around Washington, DC. The plot shows 235 tornadoes, 3291 severe winds gusts (GE 55 kt or compatible damage, blue +), and 1353 ¾ inch or larger hail reports (green dot).
Portable LMA Station • Electronics housed in shielded thermoelectric cooler enclosure • Operate from external 12 VDC battery and/or power supply. ~12 watts power • Battery operation: 48+hours (w/out cooling) 20+ hours (with cooling) • Lightweight (10 lbs) • ¼ wave ground plane antenna (Ch. 8 shown; 180-186 MHz) • Connected to receiver in box by coaxial cable • Other external connectors: GPS antenna, ethernet, 12 VDC
DC Lightning Mapping Array 68 km Circles: 150 km radius (approx. 3D coverage) 250 km radius (approx. max range)
Southern Thunder Workshop #2Fort Worth, Texas 25-27, 2005 Why DC Metro Area: • Transitional climatic regime, yet still many severe storms • Coverage of 3 major heavily used airports • Complex terrain to west, urban environment • Sterling WFO history of supporting new technology assessments • Leverage with on-going TDWR evaluations • Proximity of MDL developers to WFO forecasters • Access to students, faculty for system operations/maintenance • Local interest (broadcast community, researchers, forecasters) • DC Demo – Leverages Alliance Partner Investments • NASA (TRMM Mission Extension, LIS Validation, Applied Sciences, AMU) • NSF (New Mexico Tech portable LMA development, Texas A&M LDAR II) • OU/NSSL (WDSSII) • Vaisala (LDARII, IRAD) • WSMR/NCAR RAP Autonowcaster (Army 4DWX)