Hyperspectral remote sensing Introduction, applications and analysis software
1k likes | 2.95k Vues
Hyperspectral remote sensing Introduction, applications and analysis software. What is hyperspectral remote sensing?.

Hyperspectral remote sensing Introduction, applications and analysis software
E N D
Presentation Transcript
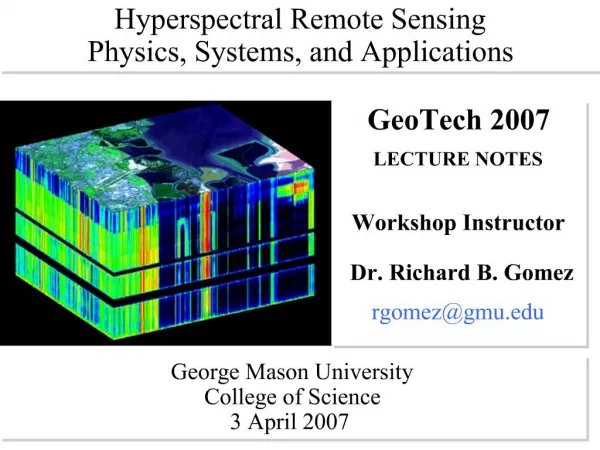
Hyperspectral remote sensingIntroduction, applications and analysis software
What is hyperspectral remote sensing? • As prreviously discussed, multispectral images are based on several wide band widths – hyperspectral remote sensors collect image data simultaneously in hundreds of narrow, adjacent spectral bands
What is hyperspectral remote sensing? • Hyperspectral images are produced by instruments called imaging spectrometers. • Convergence of two related but distinct technologies: spectroscopy and the remote imaging of Earth and planetary surfaces. • In reflected-light spectroscopy the fundamental property that we want to obtain is spectral reflectance: the ratio of reflected energy to incident energy as a function of wavelength • The overall shape of a spectral curve and the position and strength of absorption bands in many cases can be used to identify and discriminate different materials
EO appliocations • Resource management • Geological features • Vegetation discrimination • Agriculture • Mineral exploration • Environmental monitoring
EG) Mineral exploration • In inorganic materials such as minerals, chemical composition and crystalline structure control the shape of the spectral curve and the presence and positions of specific absorption bands • Wavelength-specific absorption may be caused by the presence of particular chemical elements or ions, the ionic charge of certain elements, and the geometry of chemical bonds between elements, which is governed in part by the crystal structure.
Cuprite, Nevada ‘True colour’ image ‘False colour’ hyperspectralimages using difference waveband combinations
‘True colour’ image ‘False colour’ hyperspectral image
GoogleEarth ‘true colour’ image ‘False colour’ hyperspectral image
‘Truecolour’ image ‘False colour’ hyperspectral image
Practical • TNTmips – microlitesTM • Can be used in conjunction with spectral libraries to determine the minerals present...