IN+
Flame Spectrum Deconvolution. F. Ferro 1 , J. Sanches 2 and E. C.Fernandes 1 1 Laboratory of Thermofluids, Combustion and Energy Systems - IN+ 2 Institute for Systems and Robotics Instituto Superior Técnico 1049-001 Lisbon, Portugal.

IN+
E N D
Presentation Transcript
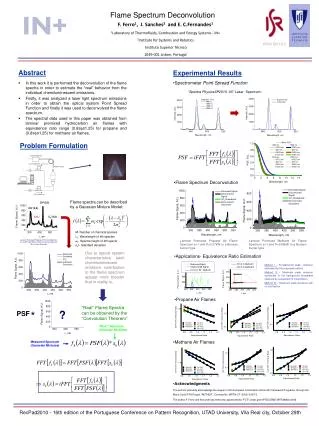
Flame Spectrum Deconvolution F. Ferro1, J. Sanches2 and E. C.Fernandes11Laboratory of Thermofluids, Combustion and Energy Systems - IN+ 2Institute for Systems and Robotics Instituto Superior Técnico1049-001 Lisbon, Portugal Laminar PremixedPropaneAirFlame Spectrum =1 and P=0.37kW in a Bunsenburnertype. Laminar PremixedMethaneAirFlame Spectrum =1 and P=0.65kW in a Bunsenburnertype. CH*(0,0) OH*(0,0) CO2* C2*(0,0) • Abstract • In this work it is performed the deconvolution of the flame spectra in order to estimate the “real” behavior from the individual chemiluminescent emissions. • Firstly, it was analyzed a laser light spectrum emissions in order to obtain the optical system Point Spread Function and finally it was used to deconvolved the flame spectrum. • The spectral data used in this paper was obtained from laminar premixed hydrocarbon air flames with equivalence ratio range (0.8≤≤1.25) for propane and (0.8≤≤1.25) for methane air flames. • Experimental Results • Spectrometer Point Spread Function “Spectra PhysicsSP2010 -05” Laser Spectrum: IN+ Problem Formulation • Flame Spectrum Deconvolution Flame spectra can be described by a Gaussian Mixture Model: ? M-Number of chemical species k- Wavelength of kth species k- Spectra height of kth specie k2- Standard deviation Laminar PremixedPropaneAirFlame Spectrum =1 and P=0.37kW in a Bunsenburnertypewith 10 mm innerdiameter * PSF Due to optical system characteristics each chemiluminescent emission contribution to the flame spectrum appear more broader that in reality is. • Applications- Equivalence Ratio Estimation Method I – Fundamental peak emission estimated by the proposed method. Method II – Maximum peak emission subtracted to the background broadband obtained by a quadratic fit interpolation. Method III – Maximum peak emission with no subtraction • Propane Air Flames “Real” Flame Spectra can be obtained by the “Convolution Theorem” “Real “ Spectrum (GaussianMixtures) • Methane Air Flames Measured Spectrum (GaussianMixtures) • Acknowledgments • The authors gratefully acknowledge the support of the European Commission within 6th Framework Programe, through the Marie Curie RTN Project "AETHER", Contract No: MRTN-CT–2006–035713. • The author F. Ferro and this work has been also sponsored by “FCT” under grant PTDC/EME-MFE/68830/2006 RecPad2010 - 16th edition of the Portuguese Conference on Pattern Recognition, UTAD University, Vila Real city, October 29th