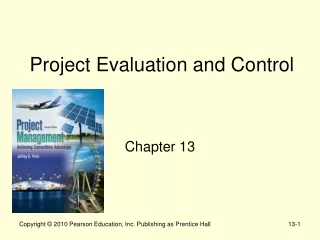
Project Evaluation and Control
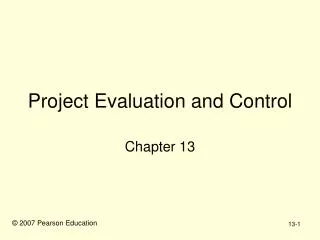
Project Evaluation and Control. Chapter 13. © 2007 Pearson Education. Setting a Goal. Taking Action and Recycling the Process. Measuring Progress. Comparing Actual with Planned. The Project Control Cycle. 60. 40. Cumulative Budgeted Cost. 20. Cumulative Actual Cost. 10. 15. 20. 25.

Project Evaluation and Control
E N D
Presentation Transcript
Project Evaluation and Control Chapter 13 © 2007 Pearson Education
Setting a Goal • Taking Action and Recycling the Process • Measuring Progress • Comparing Actual with Planned The Project Control Cycle
60 40 Cumulative Budgeted Cost 20 Cumulative Actual Cost 10 15 20 25 30 35 40 45 50 5 Elapsed Time (in weeks) The Project S-Curve Cumulative Cost ($ in thousands) $10,000 Negative Var
Milestone Analysis Milestones are events or stages of the project that represent a significant accomplishment. Milestones • signal the team and suppliers • can motivate the team • offer reevaluation points • help coordinate schedules • identify key review gates • delineate work packages
Tracking Gantt Chart Project status is updated by linking task completion to the schedule baseline
Cost Project S-Curves Cost Performance Schedule Cost Earned Value Performance Schedule Performance Schedule Tracking Control Charts Earned Value Management
Earned Value Terms • Planned value • Earned value • Actual cost of work performed • Schedule performance index • Cost performance index • Budgeted cost at completion
Steps in Earned Value Management • Clearly define each activity including its resource needs and budget • Create usage schedules for activities and resources • Develop a time-phased budget (PV) • Total the actual costs of doing each task (AC) • Calculate both the budget variance (CV) and schedule variance (SV)
AC Actual Overspend Cost PV EV Budget Slip Scheduled Performed Schedule Earned Value Milestones
Earned Value Example Value 8=80%(10) Earned Value 30=15+8+6+1 Planned Value 38=15+10+10+3 Cumulative 40=8+11+8+13
Earned Value Example Schedule Variances Planned Value (PV) = 38 = 15+10+10+3 Earned Value (EV) = 30 = 15+8+6+1 Schedule Performance Index = .79 = 30/38 = EV/PV Estimated Time to Completion = (1/.79)x4=5 Cost Variances Actual Cost of Work Performed (AC) = 40 = 8+11+8+13 Cost Performance Index = .75 = 30/40 = EV/AC Estimated Cost to Completion = 50.7 = (1/.75)x38
Completion Values in EVM Accurate and up-to-date information is critical in the use of EVM • 0/100 Rule • 50/50 Rule • Percentage Complete Rule
Human Factors in Project Evaluation & Control • Optimistic progress reports • Level of detail • Process evaluation • Non-technical performance measurement
Critical Success Factors in theProject Implementation Profile • Project mission • Top management support • Project plans & schedules • Client consultation • Personnel • Technical tasks • Client acceptance • Monitoring & feedback • Communication channels • Troubleshooting