Project Evaluation and Control
Project Evaluation and Control. Chapter 13. Learning Goals . Understand the nature of the control cycle and four key steps in a general project control model. Recognize the strengths and weaknesses of common project evaluation and control methods.

Project Evaluation and Control
E N D
Presentation Transcript
Project Evaluation and Control Chapter 13
Learning Goals • Understand the nature of the control cycle and four key steps in a general project control model. • Recognize the strengths and weaknesses of common project evaluation and control methods. • Understand how Earned Value Management can assist project tracking and evaluation. • Use Earned Value Management for project portfolio analysis. • Understand behavioral concepts and other human issues in evaluation and control.
Monitoring Project Performance • Projects are often defined by their constraints • It is vital to make sure projects are controlled as carefully as possible. Are we: • on time? • on budget? • getting results? • satisfied? • What clues will tell us when we are not meeting our goals? • These clues need to be timely and accurate
The Project Control Cycle • Setting a Goal • Corrective Action and Recycling the Process • Measuring Progress • Gap Analysis of Actual vs. Planned Performance
Budgeted Costs for Sample Project $ in thousands
60 40 Cumulative Budgeted Cost 20 Cumulative Actual Cost 10 15 20 25 30 35 40 45 50 5 Elapsed Time (in weeks) The Project S-Curve Week 23 Is this variance a good or bad factor? Actual spend $40k $10,000 Negative Variance Cumulative Cost ($ in thousands)
Milestones • Significant events or deliverables • Major project happenings • Funding points (30% of budget expended) • Key dates (April 15) • Activities of “zero duration” • Take no time; consume no resources • Serve as reminders to check on overall project status at key points Milestones are events or stages of the project that represent a significant accomplishment.
Milestone Analysis • Milestones are control devices that • signal the completion of important steps • can motivate the team • offer reevaluation points • help coordinate schedules • identify key review gates • signal when the next steps should begin • delineatevarious deliverables
Tracking Gantt Chart Project status is updated by linking task completion to the schedule baseline
Cost Earned Value Performance Schedule Earned Value Management • Earned Value Management (EVM) is a project management system that combines schedule performance and cost performance to answer the question, “What did we get for the money we spent?” • Recognizes that it is necessary to jointly consider the impact of • Time (schedule) • Cost • Project performance on current project status.
Basic Concepts of EVM • All project steps “earn” value as work is completed. • The Earned Value (EV) can then be compared to actual costs and planned costs to determine project performance and predict future performance trends. • Physical progress is measured in dollars, so schedule performance and cost performance can be analyzed in the same terms. • Based on a list of 32 criteria (revised 1996) • http://www.acq.osd.mil/evm/ • a.k.a ANSI/EIA -748 EVMS 32 Guidelines Info from http://www.earnedvaluemanagement.com/benefits.html
Earned Value Terms Basis for Earned Value Analysis: • Budgeted cost at completion (BAC) • Overall approved budget for a task. • Actual cost of work performed (AC) • Total amount spent on a task up to the current date. • Percent Complete • = Earned Value / BAC = EV / BAC • Task progress, simply the physical progress shown by the fill of the task bar.
Earned Value Terms Once basis have been established, the following calculations can be performed: • Planned value (PV) • The point along the time-phased budget that crosses the current date. • Shows the budgeted cost of scheduled work as of the current date. • Earned value (EV) =BAC x Percent Complete. • The budgeted cost of completed work as of the current date.
Performance Variance Variance Calculations: • Schedule Variance (SV) • = Earned Value – Planned Value = EV – PV • The difference between what was planned to be completed and what has actually been completed as of the current date. • Cost (Budget) Variance (CV) • = Earned Value – Actual Costs = EV - AC • The difference between the work that has been accomplished (in dollars) and how much was spent to accomplish it.
Earned Value Milestones AC Actual Overspend CV Cost PV EV Budget Slip SV Scheduled Performed Schedule
Forecasting Future Performance Trends The Schedule Performance and Cost Performance Indices (CPI) not only monitor current project performance, they can be used to predict future performance trends. • To-Complete Performance Index (TCPI) • = (BAC-EV) / (BAC-AC). • Indicates the CPI required throughout the remainder of the project to stay within the stated budget. • Estimate at Completion (EAC) • = AC + ((BAC-EV)/CPI). • A forecast of total costs that will be accrued by project completion based on past cost performance trends. • Variance at Completion (VAC) • = EAC – BAC. • The difference between the new Estimate at Completion and the original Budget at Completion.
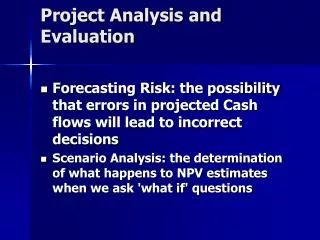
What are the benefits of using EVM? • In a typical spend plan analysis, physical progress is not taken into account when analyzing cost performance. • Instead, a project’s actual costs to date are simply compared to planned costs, often with misleading results.
Example • A task has a planned value (PV) of $1000, and actual costs (AC) of $1000. • It appears this task has perfect cost performance, and is in good shape to finish on-budget.
Example • If physical progress is taken into account, the results may differ. • The project has spent $1000 in actual costs, but is behind schedule and has only achieved $750 of Earned Value. • This is called a cost overrun, and this project would have a Cost Variance (CV) of -$250. The team spent $1000 but are only 75% complete.
Earned Value Table With Percentage Of Tasks Complete • Let’s relook at our project and see how we are doing in Week 30 $ in thousands
Calculating Earned Value • What is the earned value of the project work done to date? $ in thousands
Cumulative Budgeted Cost Cumulative Actual Cost Project Baseline, Using Earned Value • As of Week 30, what is the status of this project in terms of • Budget? • Schedule? • Performance? • How does this compare to slide 6 S-Curve? (PV) $17k Shortfallin Value Earned (EV)
Steps in Earned Value Management • Clearly define each activity including its resource needs and budget • Create usage schedules for activities and resources • Develop a time-phased budgetthat shows expenditures across the project’s life (PV) • Total the actual costs of doing each task (AC) • Calculate both the budget variance (CV) and schedule variance (SV)
Performance Indices • Schedule performance index (SPI) • =Earned Value / Planned Value = EV / PV • Schedule variance related as a ratio instead of a dollar amount. • A ratio less than 1.0 indicates that work is being completed slower than planned. • Cost performance index (CPI) • =Earned Value / Actual Costs = EV / AC • Cost variance related as a ratio instead of a dollar amount. • A ratio less than 1.0 indicates the value of the work that has been accomplished is less than the amount of money spent.
Earned Value Table- Project Mercury by June $ in thousands
Schedule Variances for EVM Schedule Variances for June • Planned Value (PV) 103 • Earned Value (EV) 44 • Schedule Performance Index (SPI) = EV/PV = 44/103 = .43 • Estimated Time to Completion = SPI ˉ ¹ X Original Time Frame = (1/.43 x 7) = 16.3 months
Cost Variances For EVM Cost Variances for June • Actual Cost of Work (AC) 78 • Earned Value (EV) 44 • Cost Performance Index (CPI)= EV/AC = 44/78 = .56 • Estimated Cost to Completion= CPI ˉ ¹ X Original Budget = (1/.56 x $118,000) = $210,714
Completion Values in EVM Accurate and up-to-date information is critical in the use of EVM • 0/100 Rule • 50/50 Rule • 0/25/50/75/100 Rule • Percentage Complete Rule See Table 13.8, page 429 for an example
Human Factors in Project Evaluation & Control • Optimistic progress reports • Level of detail • Process evaluation • Non-technical performance measurement
Critical Success Factors in theProject Implementation Profile • Project mission • The purpose of the project is clear and understood by all • Top management support • Project plans & schedules • A detailed plan of the required stages on the implementation process • Client consultation • A key stakeholder and defines value and satisfaction • Client acceptance • Personnel • Right team members with the right skill sets • Technical tasks • Team with right skill sets • Monitoring & feedback of progress vs. initial projections • Communication channels • Troubleshooting and corrective action
Discussion Questions • Why is the generic four-stage control cycle useful for understanding how to monitor and control projects? • Why was one of the earliest project tracking devices referred to as an “S-curve?” Do you see value in the desire to link budget and schedule to view project performance? • What are some of the key drawbacks with S-curve analysis? • What are the benefits and drawbacks with the use of milestone analysis as a monitoring device? • It has been said that Earned Value Management (EVM) came about because the Federal Government often used “Cost plus” contractors with project organizations. Cost plus contracting allows the contractor to recover full project development costs plus accumulate profit from these contracts. Why would requiring contractor firms to employ earned value management help the government hold the line against project cost overruns?
Discussion Questions • What are the major advantages of using EVM as a project control mechanism? What do you perceive are its disadvantages? • Consider the major findings of the research on human factors in project implementation. What common themes seem to emerge from the research of Baker, Morris, and Pinto? • The ten critical success factors have been applied in a variety of settings and project types. Consider a project with which you were involved. Did any sub-set of these factors emerge as clearly the most important for project success? Why? • Identify the following terms: PV, EV, and AC. Why are these terms important? How do they relate to each other? • What do the schedule performance index and budget performance index demonstrate? How can a project manager use this information to estimate future project performance? • Suppose the SPI is calculated as less than 1.0. Is this good news for the project or bad news? Why?
Exercise: Earned ValueManagement Calculations • You have evaluated your project and have developed the following earned value table from your analysis: • Determine the project status by calculating CV, CPI, SV, and SPI for each task and for the project overall. • What is the analysis of how the project is doing from these indicators? EV-AC EV/AC EV/PV EV-PV