Project Analysis and Evaluation
11. Project Analysis and Evaluation. Key Concepts and Skills. Understand forecasting risk and sources of value Understand and be able to do scenario and sensitivity analysis Understand the various forms of break-even analysis Understand operating leverage Understand capital rationing.

Project Analysis and Evaluation
E N D
Presentation Transcript
11 Project Analysis and Evaluation
Key Concepts and Skills • Understand forecasting risk and sources of value • Understand and be able to do scenario and sensitivity analysis • Understand the various forms of break-even analysis • Understand operating leverage • Understand capital rationing
Chapter Outline • Evaluating NPV Estimates • Scenario and Other What-If Analyses • Break-Even Analysis • Operating Cash Flow, Sales Volume, and Break-Even • Operating Leverage • Capital Rationing
Evaluating NPV Estimates • NPV estimates are just that – estimates • A positive NPV is a good start – now we need to take a closer look • Forecasting risk – how sensitive is our NPV to changes in the cash flow estimates; the more sensitive, the greater the forecasting risk • Sources of value – why does this project create value?
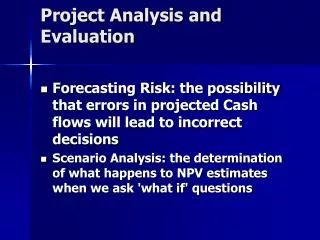
Scenario Analysis • What happens to the NPV under different cash flows scenarios? • At the very least look at: • Best case – high revenues, low costs • Worst case – low revenues, high costs • Measure of the range of possible outcomes • Best case and worst case are not necessarily probable, but they can still be possible
New Project Example • Consider the project discussed in the text • The initial cost is $200,000 and the project has a 5-year life. There is no salvage. Depreciation is straight-line, the required return is 12% and the tax rate is 34% • The base case NPV is 15,567
Sensitivity Analysis • What happens to NPV when we vary one variable at a time • This is a subset of scenario analysis where we are looking at the effect of specific variables on NPV • The greater the volatility in NPV in relation to a specific variable, the larger the forecasting risk associated with that variable and the more attention we want to pay to its estimation
Simulation Analysis • Simulation is really just an expanded sensitivity and scenario analysis • Monte Carlo simulation can estimate thousands of possible outcomes based on conditional probability distributions and constraints for each of the variables • The output is a probability distribution for NPV with an estimate of the probability of obtaining a positive net present value • The simulation only works as well as the information that is entered and very bad decisions can be made if care is not taken to analyze the interaction between variables
Making A Decision • Beware “Paralysis of Analysis” • At some point you have to make a decision • If the majority of your scenarios have positive NPVs, then you can feel reasonably comfortable about accepting the project • If you have a crucial variable that leads to a negative NPV with a small change in the estimates, then you may want to forego the project
Break-Even Analysis • Common tool for analyzing the relationship between sales volume and profitability • There are three common break-even measures • Accounting break-even – sales volume at which net income = 0 • Cash break-even – sales volume at which operating cash flow = 0 • Financial break-even – sales volume at which net present value = 0
Example: Costs • There are two types of costs that are important in breakeven analysis: variable and fixed • Total variable costs = quantity * cost per unit • Fixed costs are constant, regardless of output, over some time period • Total costs = fixed + variable = FC + vQ • Example: • Your firm pays $3000 per month in fixed costs. You also pay $15 per unit to produce your product. • What is your total cost if you produce 1000 units? • What if you produce 5000 units?
Average vs. Marginal Cost • Average Cost • TC / # of units • Will decrease as # of units increases • Marginal Cost • The cost to produce one more unit • Same as variable cost per unit • Example: What is the average cost and marginal cost under each situation in the previous example • Produce 1000 units: Average = 18,000 / 1000 = $18 • Produce 5000 units: Average = 78,000 / 5000 = $15.60
Accounting Break-Even • The quantity that leads to a zero net income • NI = (Sales – VC – FC – D)(1 – T) = 0 • QP – vQ – FC – D = 0 • Q(P – v) = FC + D • Q = (FC + D) / (P – v)
Using Accounting Break-Even • Accounting break-even is often used as an early stage screening number • If a project cannot break-even on an accounting basis, then it is not going to be a worthwhile project • Accounting break-even gives managers an indication of how a project will impact accounting profit
Accounting Break-Even and Cash Flow • We are more interested in cash flow than we are in accounting numbers • As long as a firm has non-cash deductions, there will be a positive cash flow • If a firm just breaks-even on an accounting basis, cash flow = depreciation • If a firm just breaks-even on an accounting basis, NPV < 0
Example • Consider the following project • A new product requires an initial investment of $5 million and will be depreciated to an expected salvage of zero over 5 years • The price of the new product is expected to be $25,000 and the variable cost per unit is $15,000 • The fixed cost is $1 million • What is the accounting break-even point each year? • Depreciation = 5,000,000 / 5 = 1,000,000 • Q = (1,000,000 + 1,000,000)/(25,000 – 15,000) = 200 units
Sales Volume and Operating Cash Flow • What is the operating cash flow at the accounting break-even point (ignoring taxes)? • OCF = (S – VC – FC - D) + D • OCF = (200*25,000 – 200*15,000 – 1,000,000) + 1,000,000 = 1,000,000 • What is the cash break-even quantity? • OCF = [(P-v)Q – FC – D] + D = (P-v)Q – FC • Q = (OCF + FC) / (P – v) • Q = (0 + 1,000,000) / (25,000 – 15,000) = 100 units
Three Types of Break-Even Analysis • Accounting Break-even • Where NI = 0 • Q = (FC + D)/(P – v) • Cash Break-even • Where OCF = 0 • Q = (FC + OCF)/(P – v) (ignoring taxes) • Financial Break-even • Where NPV = 0 • Cash BE < Accounting BE < Financial BE
Example: Break-Even Analysis • Consider the previous example • Assume a required return of 18% • Accounting break-even = 200 • Cash break-even = 100 • What is the financial break-even point? • Similar process to that of finding the bid price • What OCF (or payment) makes NPV = 0? • N = 5; PV = 5,000,000; I/Y = 18; CPT PMT = 1,598,889 = OCF • Q = (1,000,000 + 1,598,889) / (25,000 – 15,000) = 260 units • The question now becomes: Can we sell at least 260 units per year?
Operating Leverage • Operating leverage is the relationship between sales and operating cash flow • Degree of operating leverage measures this relationship • The higher the DOL, the greater the variability in operating cash flow • The higher the fixed costs, the higher the DOL • DOL depends on the sales level you are starting from • DOL = 1 + (FC / OCF)
Example: DOL • Consider the previous example • Suppose sales are 300 units • This meets all three break-even measures • What is the DOL at this sales level? • OCF = (25,000 – 15,000)*300 – 1,000,000 = 2,000,000 • DOL = 1 + 1,000,000 / 2,000,000 = 1.5 • What will happen to OCF if unit sales increases by 20%? • Percentage change in OCF = DOL*Percentage change in Q • Percentage change in OCF = 1.5(.2) = .3 or 30% • OCF would increase to 2,000,000(1.3) = 2,600,000
Capital Rationing • Capital rationing occurs when a firm or division has limited resources • Soft rationing – the limited resources are temporary, often self-imposed • Hard rationing – capital will never be available for this project • The profitability index is a useful tool when a manager is faced with soft rationing
Quick Quiz • What is sensitivity analysis, scenario analysis and simulation? • Why are these analyses important and how should they be used? • What are the three types of break-even and how should each be used? • What is degree of operating leverage? • What is the difference between hard rationing and soft rationing?
11 End of Chapter