Download
1 / 61
610 likes | 750 Vues
J. Maassen. CINMS. California’s Gold: Ensuring a profitable and sustainable sea urchin fishery. Sarah Teck 14 April 2011. California’s Gold (5 th largest fishery). ~66% is harvested from here. incabrain.com. ~52% is landed here. Santa Barbara. San Miguel. Santa Cruz. Santa Rosa.

E N D
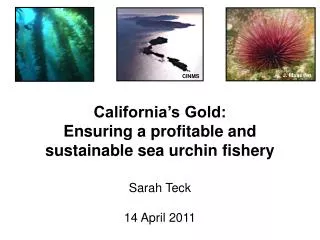
J. Maassen CINMS California’s Gold: Ensuring a profitable and sustainable sea urchin fishery Sarah Teck 14 April 2011
California’s Gold(5th largest fishery) ~66% is harvested from here incabrain.com • ~52% is landed here Santa Barbara San Miguel Santa Cruz Santa Rosa Anacapa
Red urchin fishery landings have dropped ~ 52 ~11 million lbs Data: CDF&G
Red urchin ex-vessel prices have dropped ~ 52 ~11 million lbs ~$34~$6 million Data: CDF&G
Red urchin effort has changed over time Data: CDF&G
89 mm N CA; seasonal limit # days per week 76 min size limit Moratorium on permits 83 mm S CA; seasonal limit # days per week El Niño ↓ Japanese economy ↑ market competition El Niño El Niño Data: CDF&G
Quality not only quantity and size • as with all fished species, need to consider: • population size • individual size • with urchins, also need to consider gonad quality, and how it varies across: • seasons • islands (or space)
Value increases with gonad quality P=0.0045 R2=0.71
Quality varies seasonally % gonad of whole body weight west central east
Quality varies seasonally % gonad of whole body weight { west central east
Quality varies seasonally % gonad of whole body weight { } west central east
Quality varies seasonally % gonad of whole body weight { } west central east
New strategy for fishing sea urchins • To take advantage of the high quality roe at the time when and locations where it is available, fish more in winter and in places where roe is of the highest quality. • to increase profits to urchin fishermen • to benefit sea urchin populations
Photo: CINMS Photo: J. Maassen California’s Gold: Investigating the effect of management strategies on the red sea urchin fishery and population Sarah Teck, Sarah Rathbone, Sarah Valencia, Nick Shears, Scott Hamilton, Jenn Caselle, Steve Gaines
California’s Gold(5th largest fishery) ~66% is harvested from here • ~52% is landed here www.incabrain.com Santa Barbara San Miguel Santa Cruz Santa Rosa Anacapa
Gonad quality not just size • with fished species need to wait for individuals and population growth • with urchins also need to wait for • seasonal gonad quality • gonad weight / whole body weight OR • gonad: somatic index (GSI) • need to understand more detailed ecological information on temporal and spatial variability of gonad quality fisheries management
Outline Fished quality What drives variability in gonad quality (and price) over time? III. Ecology II. Fishing behavior How does gonad quality explain behavior of fishermen? What drives variability in red urchin populations over time and space? How do urchins and fishery profits respond to various management regimes? • IV. Management
Fishermen as optimal foragers What drives variability in gonad quality (and price) over time? Fished quality • multiple linear regression • seasonality • space • ecological drivers (kelp etc.) • environmental predictors • time or date? • water temp? • day length?
400 boats surveyed 200 boats GSI Dec 2008-present location, effort, landings, GSI, price… Santa Barbara Port sampling
price is highly correlated with GSI P=0.0045 R2=0.71
variation partially explained by space west central east
GSI varies seasonally west central east
GSI decreases during spawning west central east spawning
GSI increases during regrowth west central east spawning gonadal regrowth
Outline Fished quality What drives variability in gonad quality (and price) over time? II. Fishing behavior How does gonad quality explain behavior of fishermen?
II. Fishing behavior How does gonad quality explain behavior of fishermen? • Model to predict fishing behavior (typically density is important, but in this fishery it is quality) • areas with high GSI will have high effort and over time the GSI will be driven down by high effort—then fishermen move…
Outline Fished quality What drives variability in gonad quality (and price) over time? III. Ecology II. Fishing behavior How does gonad quality explain behavior of fishermen? What drives variability in red urchin populations over time and space?
III. Ecology What drives variability in red urchin populations over time and space? Santa Barbara • Regression model to predict GSI • Temperature, abiotic factors • Reserve versus fished • Community data San Miguel Santa Cruz Santa Rosa Anacapa
Steep temperature gradient • Regression model to predict GSI • Temperature, abiotic factors • Reserve versus fished • Community data (Blanchette et al 2007)
Reserves may affect GSI • Regression model to predict GSI • Temperature, abiotic factors • Reserve versus fished • Community data (Behrens & Lafferty 2004, Lafferty & Behrens 2005)
Purples compete with reds • Regression model to predict GSI • Temperature, abiotic factors • Reserve versus fished • Community data • Purple sea urchin • Strongylocentrotus • purpuratus • Compete with reds for kelp • Currently no commercial fishery • Smaller than reds (max ~80mm) • Forms urchin barrens • long-term monitoring sites deforested by purples ~33% of the time—mostly in the east • Red sea urchin • Strongylocentrotus • franciscanus • max ~150 mm
Partnership for Interdisciplinary Studies of Coastal Oceans (PISCO) ecosystem research and monitoring (fish and benthic subtidal sampling) 32 sites summer 2009 27 sites summer 2010
GSI is higher in the west a a ab b bc cd cd bcd d d Santa Barbara San Miguel Santa Cruz Santa Rosa Anacapa
Purple urchin abundance 2007 Red urchin landings 1985-2005 Shears in prep, NPS—KFM, CDFG data
Long-term (1985-2007) E Santa Cruz and Anacapa kelp Density (m-2) purple urchins Density (m-2) red urchins Biomass (gm-2) Shears in prep, NPS—KFM data
Long-term (1985-2007) E Santa Cruz and Anacapa kelp Density (m-2) purple urchins Density (m-2) red urchins Biomass (gm-2) Shears in prep, NPS—KFM data
Long-term (1985-2007) E Santa Cruz and Anacapa kelp Density (m-2) • Red urchins have persistently higher biomass inside of the reserves. • Reproductive output is ~4 times higher in kelp forests versus urchin barrens purple urchins Density (m-2) red urchins Biomass (gm-2) Shears in prep, NPS—KFM data
manipulate ecology of a managed area to increase profits • Purple urchin removals in historical red urchin fishing grounds? • kelp restoration
Outline Fished quality What drives variability in gonad quality (and price) over time? III. Ecology II. Fishing behavior How does gonad quality explain behavior of fishermen? What drives variability in red urchin populations over time and space? How do urchins and fishery profits respond to various management regimes? • IV. Management
How do urchins and fishery profits respond to various management regimes? • IV. Management
Management goals today Fo population size Freduced Fhistorical time
Management goals today Fo population size Freduced Fhistorical time
Management goals today Fo population size or fishery profit Fseasonal quota Fhistorical time
Profits may increase with TURFs • fishermen race to harvest year-round vs. • waiting for optimal quality • How much more $ would they make, • if they waited? • delaying harvest through spatial property rights, • TURF’s (Territorial Use Rights in Fisheries) • fishermen’s profits