Download
1 / 28
290 likes | 535 Vues
PBMASS (Pedigree Based Marker Assisted Selection System). David Rodgers. PBMASS (Pedigree Based Marker Assisted Selection System). Developed by DPI&F in conjunction with GRDC projects

E N D
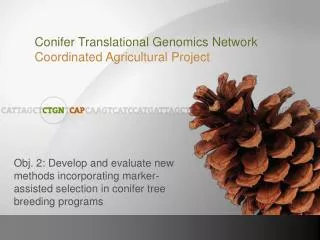
PBMASS (Pedigree Based Marker Assisted Selection System) David Rodgers
PBMASS(Pedigree Based Marker Assisted Selection System) • Developed by DPI&F in conjunction with GRDC projects • AWCMMP Project ET8 IIPedigree-based genome mapping for marker assisted selection and recurrent parent recovery in wheat and barley • Emma Mace, Phillip Banks, David Butler, Bert Collard, Mandy Christopher, Ian DeLacy, Mark Dieters, David Douglass, Jerry Franckowiak, David Jordan, Paul McGowan, Julie McKavanagh, Greg Platz, David Poulsen, David Rodgers , Tracey Shatte and John Shepherd
PBMASS(Pedigree Based Marker Assisted Selection System) • Desktop tool • Not a data repository • Integrate • Pedigree • Parse / generate purdy style pedigree strings • Manage aliases • Graphical pedigree • Marker • Graphical Genotype • Colour coded for IBD or IBS • Infer missing data • Analysed Phenotypic data • Chart on Year x Site x Trial Type x Genotype
PBMASS(Pedigree Based Marker Assisted Selection System) • Molecular marker concepts based on work done by Dr David Jordan – DPI&F principal Sorghum Breeder • Freely available on request • DPI&F breeding programs - Sorghum (224,000 genotypes), Barley (56,400 genotypes), Mungbean (2,200 genotypes), Chickpea (2,800 genotypes) and Wheat (18,600 genotypes) • PBMASS has been extremely effective in standardising and correcting genotype names and managing pedigrees in each of these breeding programs
PBMASS(Pedigree Based Marker Assisted Selection System) • Technical • C++ GUI Borland C++ builder IDE • Microsoft Access backend • MS Windows • Survey
PBMASS(Pedigree Based Marker Assisted Selection System) • Methodologies
PBMASS(Pedigree Based Marker Assisted Selection System) • IBD V’s IBS • Pedigree Inference of missing state data • Flanking marker IBD inference • Naming / Crossing tool • Data Volume handling
Identity By Descent (IBD) V’s Identity by State (IBS) • IBS – individuals assigned an identity based on allele size (state) • The same state may have resulted from separate mutational events • IBD • individuals assigned an ancestral identity based on a combination of pedigree and IBS • expressed as the ancestral genotype determined to be the source of the allele • Recursive process • Specified number of generations limits the depth of recursion • Reliant on density of data • More positive association between the marker and the trait • Coupling phase linkage
IBD FP IBS IBD MP IBS IBD FP IBS IBD MP IBS IBD FP IBS IBD MP IBS IBD • Both parents have same IBS as the genotype • Calculate IBD for Parents • If both parents have the same IBD assign this IBD to the offspring • Otherwise we cannot assign an IBD to the offspring, its IBD is itself • Includes when the IBS of one parent is unknown G IBS IBD G IBS IBD G IBS IBD
IBD FP IBS IBD MP IBS IBD FP IBS IBD MP IBS IBD • Genotype has same IBS as one parent and parents are different • Assign the IBD of the matching parent to the genotype • Genotype does not match either parent • IBD genotype = genotype G IBS IBD G IBS IBD
Pedigree Inference • Try to infer genotype G from parents • IBS FP = IBS MP => IBS G = IBS FP FP MP G P2 O1 O2 O3 On P21 O11 O21 O31 On1 P2m O3m O1m O2m Onm
Pedigree Inference • Progeny != P2 => IBS G = IBS progeny where progeny != P2 FP MP G P2 O1 O2 O3 On P21 O11 O21 O31 On1 P2n O3m O1m O2m Onm
Pedigree Inference • Progeny all the same as P2 and parents unknown • Probability G = P2 increases with number of progeny P(G = P2) = 1 – 0.5n Where n = number of offspring FP MP G P2 O1 O2 O3 On P21 O11 O21 O31 On1 P2m O3m O1m O2m Onm
Pedigree Inference • Progeny all the same as P2 and parents differ • One parent same as P2 • calculate for each P2 select highest probability FP MP P(G = P2) = 1 – ((0.5)(0.5n)) Where n = number of offspring assuming no selection G P2 O1 O2 O3 O4 P21 O11 O21 O31 O41 P2n O3n O1n O2n O4n
Virtual GenotypesFlanking Marker Inference • Generate large amounts of marker data from a small number of real datapoints. • By strategically choosing markers to be genotyped we can obtain good genome coverage at a greatly reduced cost. • Using a consensus map virtual genotypes can be created across marker types eg. dArt markers can be used to infer SSR markers.
Virtual GenotypesFlanking Marker Inference • NRP IS3614 population • 1262 markers x 46 genotypes -> possible 58,000 • Produced 35,000 IBD values from 12,000 real data points • Increase Linkage distance (5cM) and flanking marker distance (40 cM) parameters -> infer more values at lower confidence. • MKY/BNS population • Infered 81,432 IBD values from 8,256 data points
Virtual GenotypesFlanking Marker Inference • Find previous informative (has IBD) marker • Find next informative marker • If the flanking markers within a specified distance have the same IBD • Infer unknown IBD to be the same as that of the flanking markers • Or the closest informative marker is within linkage distance • Distance currently set by user • Need to calculate probability of cross-over occuring between the unknown and the flanking marker • If flanking markers differ for IBD use one with lowest probability
Flanking Marker Inference Previous Informative marker Unknown Next Informative marker Unknown Next Informative marker less than linkage distance from unknown
Data Volume Issues • Marker Data • dArt data files • Combined netcdf file and relational database • Transfer from service provider to client • csv/text files • Currently single datapoint per marker x genotype • Expecting multiple datapoints per marker x genotype • MS Excel • 2003 - 65,536 rows by 256 columns • 2007 - 1,048,576 rows by 16,384 columns • Pedigree data • Thousands of crosses generated every year • Current Sorghum PBMASS – 222,000 genotypes
Current Development • Algorithm optimizations to enhance performance • QTL overlay • Verification of existing pedigrees • Prediction of possible corrections to pedigree errors • Marker confidence level calculations • Crossing tool
Standardised naming convention Maintain traceability Automated recording of filial generation Cross information Location source Eliminate human intervention Typos Excelisms Intentional name mangling Naming/Crossing ToolThe Key to reducing nomenclature errors
Naming/Crossing Tool • Manage cross information • Year, Filial generation, breeding method, origin, location, program etc. • Generate genotype names internally • Fully configurable naming format/s • Combinations of database fields and text • Filial Generation, Location, Cross Number, Origin, year etc. • Eg. {C}YY.NNN>FFSS -> C07.005>F301 • Automatic source tracking • Seed packet and/or plot/pot • Generate diallele and factorial crosses
SeedManagement • Barcoded seed inventory system • Weight and location of seed • Store user defined data for each barcode • Powerful query manager • Links to crossing tool and PBMASS • Generate barcoded labels for • Existing genotypes • New crosses – update status of cross when weight is recoreded
Conclusion • Thanks