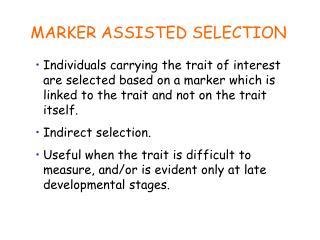
Marker Assisted Selection in Tomato
Marker Assisted Selection in Tomato Pathway approach for candidate gene identification and introduction to metabolic pathway databases. Identification of polymorphisms in data-based sequences MAS – forward selection, background selection, combining traits, relative efficiency of selection

Marker Assisted Selection in Tomato
E N D
Presentation Transcript
Marker Assisted Selection in Tomato Pathway approach for candidate gene identification and introduction to metabolic pathway databases. Identification of polymorphisms in data-based sequences MAS – forward selection, background selection, combining traits, relative efficiency of selection Why (population) size matters
Example: QTL for color uniformity in elite crosses Audrey Darrigues, Eileen Kabelka
Carotenoid Biosynthesis: Candidate pathway for genes that affect color and color uniformity. Disclaimer: this is not the only candidate pathway…
Databases that link pathways to genes http://www.arabidopsis.org/help/tutorials/aracyc_intro.jsp
Databases that link pathways to genes http://metacyc.org/ http://www.plantcyc.org/ http://sgn.cornell.edu/tools/solcyc/ http://www.arabidopsis.org/biocyc/index.jsp http://www.arabidopsis.org/help/tutorials/aracyc_intro.jsp External Plant Metabolic databases CapCyc (Pepper) (C. anuum) CoffeaCyc (Coffee) (C. canephora) SolCyc (Tomato) (S. lycopersicum) NicotianaCyc (Tobacco) (N. tabacum) PetuniaCyc (Petunia) (P. hybrida) PotatoCyc (Potato) (S. tuberosum) SolaCyc (Eggplant) (S. melongena)
Check boxes (Note: MetaCyc has many more choices, but no plants)
Capsicum annum sequence retrieved Scroll down page
Query CCACCACCATCCTCACTTTAACCCACAAATCCCACTTTCTTTGGCCTAATTAACAATTTT |||||||||||||||||||||||||||||||||| ||||||||||||||||||||||||| Sbjct CCACCACCATCCTCACTTTAACCCACAAATCCCATTTTCTTTGGCCTAATTAACAATTTT Zeaxanthin epoxidase Probable location on Chromosome 2 Alignment of Z83835 and EF581828 reveals 5 SNPs over ~2000 bp
Candidates identified in other databases are here Information missing from other databases is here…
Comment on the databases: Information is not always complete/up to date. Display is not always optimal, and several steps may be needed to go from pathway > gene > potential marker. Sequence data has error associated with it. eSNPs are not the same as validated markers. There is a wealth of information organized and available. We will be asking for feed-back RE how best to improve the SGN database and access via the Breeders Portal
The previous example detailed how we might identify sequence based markers for trait selection. Query CCACCACCATCCTCACTTTAACCCACAAATCCCACTTTCTTTGGCCTAATTAACAATTTT |||||||||||||||||||||||||||||||||| ||||||||||||||||||||||||| Sbjct CCACCACCATCCTCACTTTAACCCACAAATCCCATTTTCTTTGGCCTAATTAACAATTTT Improving efficiency of selection in terms of 1) relative efficiency of selection, 2) time, 3) gain under selection and 4) cost will benefit from markers for both forward and background selection. Remainder of Presentation will focus on Where to apply markers in a program Forward and background selection Marker resources Alternative population structures and size
Comparison of direct selection with indirect selection (MAS). Relative efficiency of selection:r(gen) x {Hi/Hd} Line performance over locations > MAS > Single plant
Accelerating Backcross Selection F1 50:50 Expected proportion of Recurrent Parent (RP) genome in BC progeny BC1 75:25 BC2 87.5:12.5 BC3 93.75:6.25 BC4 96.875:3.125
References: Frisch, M., M. Bohn, and A.E. Melchinger. 1999. Comparison of Selection Strategies for Marker-Assisted Backcrossing of a Gene. Crop Science 39: 1295-1301.
Progeny needed for Background Selection During MAS Q10 indicates a 90% probability of success From Frisch et al., 1999.
Marker Data Points required (Modified from Frisch et al., 1999; based on assumption of 12 chromosomes; initial selection with 4 markers/chromosome)
For effective background selection we need: Markers for our target locus (C > T SNP for Zep) Markers on the target chromosome (Chrom. 2) Markers unlinked to the target chromosome
http://www.tomatomap.net http://sgn.cornell.edu/
44 polymorphic markers 55 polymorphic markers
Missing data in SGN Limited ability to generate tables, PCR conditions sometimes incomplete, Enzyme sometimes missing, SNP not described. Missing data in Tomatomap.net SNP and sequence context requires BMC genomics supplemental table , ASPE primers, GoldenGate primers. 2007. BMC Genomics 8:465 www.biomedcentral.com/content/pdf/1471-2164-8-465.pdf
Where can we expect to be? analysis by Buell et al., unpublished Data based on estimated ~42% of sequence, therefore expect as many as 300 markers for a cross like E6203 x H1706
QTL’s mapped in a bi-parental cross may not be appropriate for MAS in all populations… Marker allele and trait may not be linked in all populations. Genetic background effects may be population specific. Original association may be spurious. QTL detection is dependent on magnitude of the difference between alleles and the variance within marker classes. What about mapping and MAS in unstructured populations? A brief introduction to “Association Mapping” follows.
“Association Mapping” statistical model – designed to account for population structure (Q), correct for genetic background effects (Z), and identify marker-trait linkage (Marker) Y = μ REPy + Qw + Markerα + Zv + Error
Tomato populations will have sub-structure K=4 1 2 3 4 1) Fresh Market (FM) ; 2) Landrace; 3) Heirloom; 4) Processing K=8 1 2 3 4 5 6 7 8 1,6,7) Processing; 2) Landrace: 3,5) FM; 4) FM & Processing; 8) Heirloom Output from Pritchard’s “STRUCTURE”
Association mapping Incorporates population structure and coefficient of relatedness The number of markers needed depends on the rate of LD decay (reflects recombination history) Highly specific to “inference population” wild species vs breeding program Sensitive to marker coverage LD decay and number of alleles (Nor, gf, and others all have multiple alleles within populations used by breeders) Will not be able to “map” traits where trait variation overlaps with population structure.
Even without sequence or marker data, there are lessons for practical breeding: Use pedigree data, knowledge of population structure, and objective data to increase precision of estimates of breeding value.
Take home messages: Marker resources exist for forward and background selection in elite x elite crosses in tomato. Marker resources are currently not sufficient for QTL discovery in bi-parental or AM populations; they will soon be. The best time to use genetic markers : early generation selection Restructuring of breeding program to integrate markers may include: 1) Increasing genotypic replication (population size) at the expense of replication (consider augmented designs). 2) Collecting objective data. Further discussion of AM approach in session VI “Unstructured mapping of bacterial spot resistance”
References: Kaepler, 1997. TAG 95:618-621. Frisch, et al., 1999. Crop Science 39: 1295-1301. Knapp and Bridges, 1990. Genetics 126: 769-777. Yu et al., 2006. Nature Genetics 38:203-308. Van Deynze et al., 2007. BMC Genomics 8:465 www.biomedcentral.com/content/pdf/1471-2164-8-465.pdf