Download
1 / 34
350 likes | 549 Vues
Environmental Science: Toward a Sustainable Future Richard T. Wright. Chapter 5. The Human Population: Dimensions. Human Population Growth and the Consequences. Human population expansion and its cause Different worlds Consequences of population growth and affluence

E N D
Environmental Science: Toward a Sustainable Future Richard T. Wright Chapter 5 The Human Population: Dimensions
Human Population Growth and the Consequences • Human population expansion and its cause • Different worlds • Consequences of population growth and affluence • Dynamics of population growth
Some Bottom Lines • There are probably too many of us on the planet for any pleasant sustainable scenario • Rich countries (us) use up lots of resources; however, we degrade the environment less (except CO2) • You can actually break up the world into three categories, not just rich & poor • Poor countries degrade the environment more than rich countries, but use less resources.
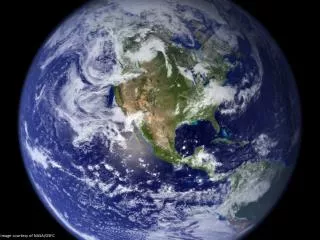
Human Population Expansion and Its Cause • Reasons for the patterns of growth • Biotic potential exceeds environmental resistance: birth rates exceed death rates • There are ~6.7 billion people on Earth (5/08) • If each one stood up, pronounced their name, and sat down • It would take ~600 years to complete roll call • By 2025 it will take 1,000 years to complete this exercise
World Population over the Centuries 9,000 human beings added to the planet every hour
A little math • To determine the doubling time in years, take 70 and divide by the growth rate as a percentage • Population grows @ 1%/year, doubles in 70/1= 70 years. • Population grows @ 4%/year, doubles in 70/4= 17.5 years.
Reasons for the Human Population Explosion • Causes of disease recognized • Improvements in nutrition • Discovery of antibiotics • Improvements in hygeine & medicine • Increase in number of women who actually reach child-bearing age • Short doubling times in some countries(really an effect, not a cause) !!!!Microbiology Rocks!!!!(or not)
America West Germany Africa 14 5 258 Average Number of Children, Grandchildren, and Great Grandchildren
Different Worlds • Rich nations, poor nations • Population growth in rich and poor nations • Different populations, different problems
Human Poverty Index for Developing Countries Fig. 5-5; Table 5-2 for Selected countries
Economic Categories Based on Per Capita Gross National Income (see Fig. 5-4) • High-income, highly developed, industrialized countries (~ 1 Billion) • United States, Japan, Canada, W. Europe • Average GNI per capita = $26,710 • Middle-income, moderately developed countries (~2.7 Billion) • Latin America, South Africa, China • Average GNI per capita = $1,850 Fig. 5-4-world
Economic Categories Based on Per Capita Gross National Income (see Fig. 5-4) • Low-income, developing countries (~2.7 B) • Western and central Africa, India, central Asia • Average GNI per capita = $430
Different Populations, Different Problems • Human pressure on the environment caused by three factors • Population size • Affluence • Technology • Complicated- overall, rich, crowded nations have better environments than poor crowded nations.
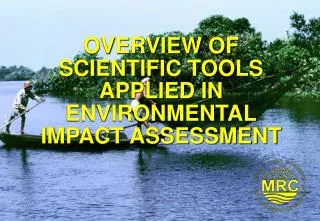
Ecological Footprints by World Region • The average American places at least 20 times the demand on Earth’s resources as does an average person in Bangladesh Fig. 5.7 here
Developing or Developed Nations? • High fertility rates • High consumptive lifestyles: use 80% of world’s wealth • Intense poverty • Eat high on the food chain
Developing or Developed Nations? • Long doubling times • High environmental degradation • Twenty percent of the world’s population
Consequences of Population Growth and Affluence • The developing countries • Affluence
The Developing Countries • Reform the system of land ownership • Intensify cultivation of existing land to increase production per unit area , • Open new land to farm , • Move to cities and seek employment , • Engage in illicit activities for income • Move to other countries , How do these “solutions” aggravate the problems?
Consequences of Exploding Populations in the Developing World
Consequences of Exploding Populations deforestation resource depletion loss of agricultural land biodiversity disease pest resistance population migration irrigation wetlands MORE More Population Causes LESS
Affluence in the United States • Consume the largest share of 11 of 20 major commodities (so others sell to us) • Eat more than three times the global average in meat • Lead the world in paper consumption (so?) • Environment improves with increasing affluence
Affluence in the United States • Enables wealthy to clean up immediate environment by transferring waste to more distant locations. (mostly CO2) • Affluent isolate themselves and unaware of the environmental stresses caused by their consumptive lifestyles. • QUESTION: If the rich nations all took a “vow of poverty”, what would happen to the poor nations, in terms of population growth, rates of poverty, environmental degradation?
Dynamics of Population Growth • Population profiles • Future populations • Population momentum • The demographic transition
Population Profile for United States Note increasing elderly population.
Population Projections: Developing Nations Iraq- not a good choice, considering the instability there.
Comparing Projected Populations (see Fig. 5-17) Fertility Rate < 2 Fertility Rate > 2
Population Momentum • Countries like Iraq will continue to grow for 50–60 years even after the total fertility rate is reduced to replacement level.
Things to know from Chapter 5:See the bottom line, slide Terms, table 5-1Low, middle, & high income countries, fraction of total population in eachCalculate doubling time, given growth rateEffect of development & population growth upon environmental degradationSize of ecological footprint of US vs a developing nation (20X)Recognize the development profile of a country before and after the demographic transition.Reasons for the fertility transition