Download
1 / 17
170 likes | 269 Vues
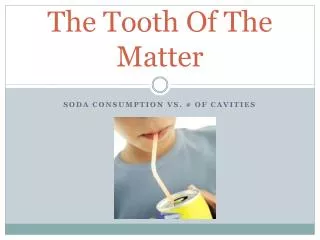
Analyzing the impact of soda consumption on cavities. Data from 35 participants collected through systemic sampling reveals insights. Despite a correlation between soda intake and cavities, statistical analysis shows no significant relationship. However, preventive dental tips are recommended for maintaining oral health. Moderation in soda consumption is advised for better dental care.

E N D
The Tooth Of The Matter Soda Consumption vs. # of Cavities
Gathering the data….. We obtained 35 people for the random sample. We used a systemic sampling process. The goal would be for each of us to collect seven responses, from contacts in the mall/work. We started at the 7th contact, and sampled every 9th contact until our desired number of responses had been collected.
The Data Soda consumption & Cavities Reported
Amount of Soda • Mean: 46.4 • Standard Deviation: 82.5246 • Five number summary: • Min: 0 • Q1: 0 • Med: 12 • Q3: 48 • Max: 336 • Range: 336 • Mode: 0 • Outliers: 336 Our first quantitative variable is daily soda consumption. The unit of measurement for this variable is ounces. Values for this first quantitative variable are 12oz, 24oz, and 36oz 48 oz.
The United States ranks first among countries for soft drink consumption with a per capita consumption of approximately 15 ounces a day. Source: http://www.everyday-wisdom.com/soft-drink-consumption.html
Sugar and acid in soft drinks so easily dissolves tooth enamel.. Enamel breakdown leads to cavities.
Number of Cavities • Mean: 6.9 • Standard Deviation: 8.8 • 5 Number Summary- • Min:0 • Q1: 1 • Med: 3 • Q3: 9 • Max: 40 • Range: 40 • Mode: 0 • Outliers: 24, 40 The second quantitative variable is how many cavities a person has had. The unit of measurement for this variable is one unit for every cavity a person has had. Values for this second quantitative variable are 1 cavity, 2 cavities and 3 cavities 4 cavities
“Sip all day. Get decay.” -Minnesota Dental Association
Drinking soda pop regularly increases your chances of tooth decay and staining. Source: http://www.badbreath-cure.info/teeth-decay/is-drinking-coca-cola-bad-for-your-teeth/#more-559
So….? So what does the data say? Is there a relationship?
………………… Our R-value came to 0.2982 which was less than Our p value of p <.05. This showed us that there is not asignificant relationship between soda consumption and cavities.
However… Scatter plot W/Regression As the soda consumption increased, the number of cavities increased also with those individuals….so it may not be an immediate cause, but does have some impact.
Dental Tips Substitute different drinks Rinse with water Use fluoride and mouth rinse Use a straw to sip your soda
Be Soda Smart! Soda is not evil…. But drink it moderately….
But remember, your teeth are counting on you. So enjoy a soda!