Enhancing Helpdesk Performance: Strategies for Increased User Satisfaction and Efficiency
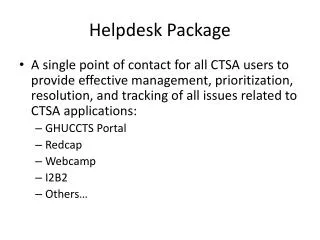
This report outlines the current state of the helpdesk service, detailing call statistics and user perceptions. With an average of 600 calls weekly, only 20% of issues are resolved on the first contact. To improve, the objectives include increasing first-time resolution rates to 80% and user satisfaction to 75%. Key elements for success involve better training, improved procedures, and enhanced tools for helpdesk personnel. The findings suggest significant discrepancies between user expectations and actual performance, with a promising "Backing Up" model showing potential in improving support.


Enhancing Helpdesk Performance: Strategies for Increased User Satisfaction and Efficiency
E N D
Presentation Transcript
Helpdesk Changes Desktop Forum L. Pregernig, 2000-05-29
Helpdesk Changes: Current Situation • Some statistics – “Average Week” • “Average week”: 600 calls • Answered “first time”: 215 • Escalated: 160 by design (eg, EDMS), 225 unresolved to Level 2 • Figures correspond to expected performance at the contract level • User perceptions • “Helpdesk not functioning” • Translates into: “support chain not working”,because users typically refer to the “entry point” (Helpdesk) • Call avoidance • User strategies: ask a colleague, email a friend, call Helpdesk • Comparison with industry (Gartner Group):Industry: 1-2 calls per month and desktopCERN: 0.3-0.6 calls per month and desktop
Helpdesk Changes: Objectives • Objectives • Increase first-time problem resolution (as seen by the users) from “20%” to 80%, reach user satisfaction level of 75% • Higher skills at Helpdesk • Extend time (now 10’) to find a solution at first call • Improved procedures: close open loops with service providers (information), quality assurance of replies, ticket flow (user wants a problem solution), • “Engineer in charge”: responsible to the user for problem resolution, quality assurance, user information (Zephyr, Web content, service status), link between users and service providers • Better tools: content of, and access to, knowledge database (Q&As), automated support actions (quota?)
Helpdesk Changes: Getting There • Reaching the objectives • Information gathering • Shifts with Helpdesk • Industry comparisons • Helpdesk backing up • Analyze findings • Shifts with Helpdesk (Feedback given to Helpdesk): communication, “personal” approaches, training, user expectations, working conditions • Industry comparisons: somewhat difficult Remedy tickets “domain oriented” (eg, mail, Web), industry uses Gartner Group categories (“How to”, “Break/Fix”), data mining done • “Helpdesk backing up”: during 2 weeks Helpdesk backed up with one staff from IT-US: jump in first-call resolution observed • Redesign current model • “Backing up Helpdesk” looks very promising • In-depth test during 4 weeks, running since 6 May
Helpdesk Changes: Summary • Summary • Discrepancy between user expectations/perceptions and contract performance • Contract funding subject to CERN policies • “Backing Up” model looks very promising • Implementation target: “Summer 2002”