Boundary Layer Ventilation by Convection and Coastal Processes
230 likes | 362 Vues
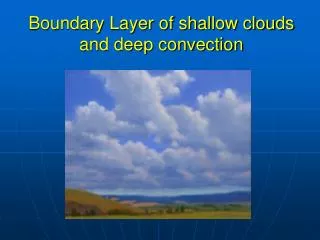
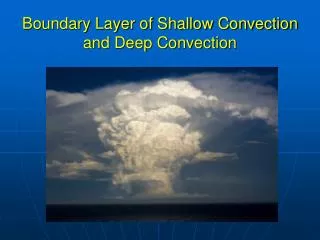
Boundary Layer Ventilation by Convection and Coastal Processes. Helen Dacre, Sue Gray, Stephen Belcher. Didcot power station, Oxfordshire. Motivation. Mixing ?. Convection ?. Advection ?. Boundary layer ~1km. Talk Outline. Modelling Experiment Case study – May 9 th 2005

Boundary Layer Ventilation by Convection and Coastal Processes
E N D
Presentation Transcript
Boundary Layer Ventilation by Convection and Coastal Processes Helen Dacre, Sue Gray, Stephen Belcher Didcot power station, Oxfordshire Helen Dacre AGU Dec 2008
Motivation Mixing ? Convection ? Advection ? Boundary layer ~1km Helen Dacre AGU Dec 2008
Talk Outline • Modelling Experiment • Case study – May 9th 2005 • Results from modelling experiments • Comparison with observations • Ventilation estimate • Conclusions • Future Work Helen Dacre AGU Dec 2008
Met Office Unified Model Limited area domain over Europe, ∆x≈12km, ∆z≈100m in boundary layer, 500m in mid-troposphere Parameterized convection and boundary layer turbulent mixing Pollution sources represented by constant emission of tracers over land emitted 20m above the surface Different ventilation mechanisms represented by advection, convectionand turbulent mixingschemes Tracers transported by different combinations of transport schemes Experimental Setup Helen Dacre AGU Dec 2008
May 2005 Case Study Overview UK Met Office surface pressure analysis 00UTC Modis Aqua visible 12:45 UTC Nimrod radar composite 13:00 UTC Helen Dacre AGU Dec 2008
Advection 09 UTC wind direction Tracer in free troposphere integrated over height 13 UTC 17 UTC wind direction 17 UTC kg/m2 land coast sea Helen Dacre AGU Dec 2008
Advection and Mixing 09 UTC Tracer in free troposphere integrated over height 13 UTC 17 UTC 17 UTC kg/m2 land coast sea Helen Dacre AGU Dec 2008
09 UTC Advection, Mixing and Convection Tracer in free troposphere integrated over height 13 UTC 17 UTC 17 UTC kg/m2 land coast sea Helen Dacre AGU Dec 2008
AMPEP Observations (Aircraft Measurements of chemical Processing and Export fluxes of Pollutants) • Direct measurements of the mass budgets of pollutants in the boundary layer over the UK Upwind air measurements (background concentrations) Z Downwind air measurements (mass flux of pollution coming off UK) Helen Dacre AGU Dec 2008
AMPEP flight AMPEP flight path AMPEP flight height wind direction I G D Helen Dacre AGU Dec 2008
Boundary layer profile in central England Model tracer profile AMPEP CO profile 17:24 UTC boundary layer top background concentration Helen Dacre AGU Dec 2008
Polluted profile in English Channel Model tracer profile AMPEP CO profile 15:34 UTC elevated pollution Helen Dacre AGU Dec 2008
Quantifying Ventilation ? ? ? Helen Dacre AGU Dec 2008
adv adv adv + mix adv + mix adv, mix + conv adv, mix + conv Quantifying Ventilation Percentage of tracer in free troposphere Percentage of tracer above 2km 52% % of tracer in free troposphere % of tracer above 2km 26% Time of day (hours) Time of day (hours) sunrise sunset sunrise sunset Helen Dacre AGU Dec 2008
Case Study Summary Helen Dacre AGU Dec 2008
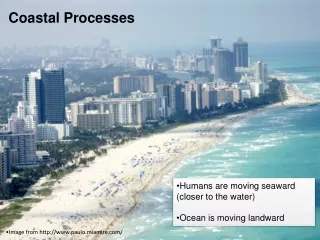
Conclusions • NWP model output is a useful tool and can complement observational results in studying transport processes • Assumption that ventilation of the boundary layer is negligible during non-frontal events is not always valid • Convection can transport polluted air out of bl and form a distinct layer in the free troposphere • Coastal outflow can transport pollution above the marine boundary layer • Sea-breeze can enhance coastal outflow and create a layer of polluted air above a layer of clean air along the coast • Turbulent mixing and convection can double the amount of pollution ventilated from the boundary layer Helen Dacre AGU Dec 2008
Further Work • How sensitive are model simulations of the distribution of pollutants to the representation of convective transport? • How well is the sea-breeze represented at 12km resolution? • Are Meteorological models suitable for chemical dispersion studies? • What are the relative importance of these ventilation processes on pollution distribution on longer timescales? Reference H.F.Dacre, S.L.Gray and S.E.Belcher (2007), A case study of boundary layer ventilation by convection and coastal processes, J. Geophys. Res., 12, D17106, doi:10.1029/2006JD007984 Helen Dacre AGU Dec 2008
Schematic of boundary layer ventilation for 9th May 2005 Helen Dacre AGU Dec 2008
09 UTC Advection Height above surface (m) • Cross-sections of potential temperature • Bold contours indicate inversions • Dashed line indicates boundary layer top land coast sea 13 UTC coast 11 UTC over land 15 UTC over sea Helen Dacre AGU Dec 2008
Introduction Neighbourhood scale Regionalscale Street scale City scale 200km 20km 2km 200m 10m 100m 10km 1km • The dynamical processes that transport pollution within and above urban areas span a large range of spatial and temporal scales Helen Dacre AGU Dec 2008
Introduction • There are many transport processes responsible for the ventilation of pollution from the boundary layer into the free troposphere Helen Dacre AGU Dec 2008