Download
1 / 12
290 likes | 984 Vues
Measures of Central Tendency. The mean , the median , and the mode are called measures of central tendency. They describe a set of data, or a set of numbers, by a single “middle” number. Mean (Average).

E N D
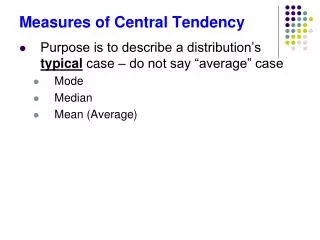
Measures of Central Tendency The mean, the median, and the mode are called measures of central tendency. They describe a set of data, or a set of numbers, by a single “middle” number.
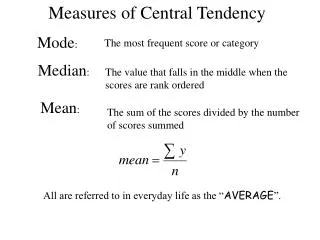
Mean (Average) The most common measure of central tendency is the mean (sometimes called the “arithmetic mean” or the “average”). The mean (average) of a set of number items is the sum of the items divided by the number of items.
Finding the Mean Find the mean of the following list of numbers. 2.5 5.1 9.5 6.8 2.5 Continued.
Finding the Mean The mean is the average of the numbers: 2.5 5.1 9.5 6.8 2.5
Median You may have noticed that a very low number or a very high number can affect the mean of a list of numbers. Because of this, you may sometimes want to use another measure of central tendency, called the median. The median of an ordered set of numbers is the middle number. If the number of items is even, the median is the mean (average) of the two middle numbers.
Finding the Median Find the median of the following list of numbers. 2.5 5.1 9.5 6.8 2.5 Continued.
Helpful Hint In order to compute the median, the numbers must first be placed in order.
Mode The mode of a set of numbers is the number that occurs most often. (It is possible for a set of numbers to have more than one mode or to have no mode.) If the set of data has two modes, it is called bimodal.
Finding the Mode The mode occurs the most often: 2.5 5.1 9.5 6.8 2.5 The mode is 2.5.
Helpful Hint Don’t forget that it is possible for a list of numbers to have no mode. For example, the list 2, 4, 5, 6, 8, 9 has no mode. There is no number or numbers that occur more often than the others.
Range The range of a set of numbers is the numerical difference between the greatest and the least numbers in the set. Example: In the set of numbers: 3, 6, 7, 17, 23 The range of the set is 23-3, which is 20.
Examples Find the (a) range, (b) mode, (c) median, and (d) mean of the following numbers: 9, 8, 2, 4, 5, 4, 6 Round any decimal results to two decimal places. The height of the first of three buildings was 420 feet. The height of the second building was 380 feet. What was the height of the third building if the mean height of the three buildings was 430 feet?