Download
1 / 22
220 likes | 339 Vues
Lab 2, assignment 1: OLS regression of electricity consumption on temperature at 53 sites. SAS code for ridge regression. proc reg data=mining.dailytemperature outest = dtempbeta ridge= 0 to 10 by 1 ; model daily_consumption = stockholm g_teborg malm_ /p;

E N D
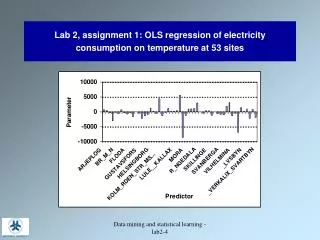
Lab 2, assignment 1: OLS regression of electricity consumption on temperature at 53 sites Data mining and statistical learning - lab2-4
SAS code for ridge regression procreg data=mining.dailytemperature outest = dtempbeta ridge=0 to 10 by 1; model daily_consumption = stockholm g_teborg malm_ /p; output out=olsoutput pred=olspred; procprint data=dtempbeta; run; Data mining and statistical learning - lab2-4
Estimated regression parameters in ridge regression Data mining and statistical learning - lab2-4
Predicted vs observed values in OLS regression and ridge regression- trade-off between variance and bias Data mining and statistical learning - lab2-4
Fat content vs absorbance in different channels (wavelengths) Data mining and statistical learning - lab2-4
OLS regression fat vs channel10, channel30, channel50, channel70, channel90 Data mining and statistical learning - lab2-4
OLS regression fat vs channel1 – channel 100 Data mining and statistical learning - lab2-4
OLS regression fat vs channel1 – channel 100 Data mining and statistical learning - lab2-4
OLS regression with strongly correlated predictors If the XTX matrix has not full rank (some X-variables are linearly dependent) the mean square solution is not unique If the X-variables are strongly correlated, then: (i) the regression coefficients will be uncertain; (ii) the predictions may be OK Data mining and statistical learning - lab2-4
Principal Component Analysis of lake survey data Some variables vary much more than others How does this influence principal components derived from the covariance and correlation matrices, respectively? Data mining and statistical learning - lab2-4
Principal Component Analysis of lake survey data- score plot derived from the correlation matrix Data mining and statistical learning - lab2-4
Principal Component Analysis of lake survey data- eigenvectors derived from the correlation matrix Data mining and statistical learning - lab2-4
Principal Component Analysis of lake survey data with outliers removed- score plot derived from the correlation matrix Data mining and statistical learning - lab2-4
Principal Component Analysis of lake survey data with outliers removed - eigenvectors derived from the correlation matrix Data mining and statistical learning - lab2-4
Principal Component Analysis of lake survey data with outliers removed- MINITAB score plot derived from the correlation matrix Data mining and statistical learning - lab2-4
Principal Component Analysis of lake survey data with outliers removed - MINITAB loading plot derived from the correlation matrix Data mining and statistical learning - lab2-4
Regression of an indicator matrix Find a linear function which is (on average) one for objects in class 1 and otherwise (on average) zero Find a linear function which is (on average) one for objects in class 1 and otherwise (on average) zero Assign a new object to class 1 if Data mining and statistical learning - lab2-4
Discriminant analysis- decision border Data mining and statistical learning - lab2-4
3D-plot of an indicator matrix for class 1 Data mining and statistical learning - lab2-4
3D-plot of an indicator matrix for class 2 Data mining and statistical learning - lab2-4
Regression of an indicator matrix- discriminating function Estimate discriminant functions for each class, and then classify a new object to the class with the largest value for its discriminant function Data mining and statistical learning - lab2-4
Linear discriminant analysis (LDA) LDA is an optimal classification method when the data arise from Gaussian distributions with different means and a common covariance matrix Data mining and statistical learning - lab2-4