1 / 75

VISTAS Meteorological Modeling 2002 Simulation May 25, 2004 National RPO Modeling Meeting

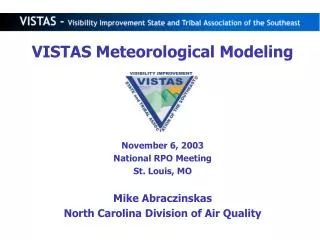
VISTAS Meteorological Modeling 2002 Simulation May 25, 2004 National RPO Modeling Meeting Denver, CO George Bridgers North Carolina Division of Air Quality. Introduction. MM5 v3.6.1+ (Sea Ice Differences Only) MM5 v3.6.2 Preprocessors Reisner 1 w/ Mixed Ice Physics

faunia
Télécharger la présentation

VISTAS Meteorological Modeling 2002 Simulation May 25, 2004 National RPO Modeling Meeting

An Image/Link below is provided (as is) to download presentation Download Policy: Content on the Website is provided to you AS IS for your information and personal use and may not be sold / licensed / shared on other websites without getting consent from its author. Content is provided to you AS IS for your information and personal use only. Download presentation by click this link. While downloading, if for some reason you are not able to download a presentation, the publisher may have deleted the file from their server. During download, if you can't get a presentation, the file might be deleted by the publisher.

E N D

Presentation Transcript


  1. VISTAS Meteorological Modeling • 2002 Simulation • May 25, 2004 • National RPO Modeling Meeting • Denver, CO • George Bridgers • North Carolina Division of Air Quality

  2. Introduction • MM5 v3.6.1+ (Sea Ice Differences Only) • MM5 v3.6.2 Preprocessors • Reisner 1 w/ Mixed Ice Physics • Kain-Fritsch 2 Cumulus Parameterization • ACM Planetary Boundary Layer (PBL) Model • Pleim-Xiu Land Surface Model LSM (EPA’s MPP version) • independent segments (cold start)-no INTERPPX • INTERPPXis used to initialize soil moisture, canopy moisture, and soil temperature from a previous run when simulation time periods overlap. • Using INTERPPX resulted in a significant wintertime cold bias in sensitivity testing.

  3. Introduction (cont.) • MM5 executed in 5.5 day segments • 76 total segments • 00Z Dec 17, 2001 start • dec17_01 date tag • 12Z Jan 1, 2003 finish • Last hour of dec27_02 segment

  4. Evaluation Procedures • Full suite of evaluation products available for each segment • Surface Products • Spatial • Time series • Combination • Aloft Products • Spatial • Sounding • Profiler • Statistical Products • Surface time series • Aloft time series • Tables

  5. Evaluation Procedures • Need to Summarize Results • Monthly Products • Statistical Tables • Spatial Summary Plots • “Bakergrams” (annual) • “Bakergrams” (monthly) • Spatial Statistical Plots

  6. Statistical Charts

  7. Monthly VISTAS Statistics

  8. Seasonal VISTAS Statistics

  9. Day/Night VISTAS Statistics, 36km

  10. Day/Night VISTAS Statistics, 12km

  11. Monthly VISTAS Statistics

  12. Seasonal VISTAS Statistics

  13. Day/Night VISTAS Statistics, 36km

  14. Day/Night VISTAS Statistics, 12km

  15. Monthly VISTAS Statistics

  16. Seasonal VISTAS Statistics

  17. Day/Night VISTAS Statistics, 36km

  18. Day/Night VISTAS Statistics, 12km

  19. Monthly VISTAS Statistics

  20. Seasonal VISTAS Statistics

  21. Day/Night VISTAS Statistics, 36km

  22. Day/Night VISTAS Statistics, 12km

  23. Monthly VISTAS Statistics

  24. Seasonal VISTAS Statistics

  25. Day/Night VISTAS Statistics, 36km

  26. Day/Night VISTAS Statistics, 12km

  27. Monthly VISTAS Statistics

  28. Seasonal VISTAS Statistics

  29. Day/Night VISTAS Statistics, 36km

  30. Day/Night VISTAS Statistics, 12km

  31. Monthly VISTAS Statistics

  32. Seasonal VISTAS Statistics

  33. Day/Night VISTAS Statistics, 36km

  34. Day/Night VISTAS Statistics, 12km

  35. Monthly VISTAS Statistics

  36. Seasonal VISTAS Statistics

  37. Day/night VISTAS Statistics, 36km

  38. Day/night VISTAS Statistics, 12km

  39. Monthly VISTAS Statistics

  40. Seasonal VISTAS Statistics

  41. Annual Bakergrams

  42. Monthly Bakergrams

More Related