Group 7 Public Transit Bus Comparison
Group 7 Public Transit Bus Comparison. By: David Berdahl (Organizer) Joshua Warwick (Techie) Tony Nong (Summarizer). The Project. Public Transportation Bus. 7 Year Bus. 10 Year Bus. $80,000. $185,000. Bus Descriptions. 10 Year Bus ($185,000) Freightliner Chassis CNG Powered

Group 7 Public Transit Bus Comparison
E N D
Presentation Transcript
Group 7Public Transit Bus Comparison By: David Berdahl (Organizer) Joshua Warwick (Techie) Tony Nong (Summarizer)
The Project • Public Transportation Bus 7 Year Bus 10 Year Bus $80,000 $185,000
Bus Descriptions • 10 Year Bus ($185,000) • Freightliner Chassis • CNG Powered • 20 passenger (18 Regular + 2 Wheelchair) • 7 Year Bus ($80,000) • Ford Chassis • Diesel Powered • 20 passenger (18 Regular + 2 Wheelchair)
Assumptions • City is buying a new bus and needs to decide which one is more economical (Fixed output) • Catastrophic engine failure is not included • Both busses will bring in the same amount of profit (customer preference) • Pollution Regulations
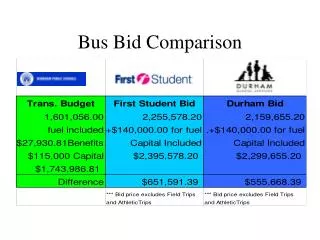
7 yrs bus Salvage value $2,500 Insurance/year $13,200 Maintenance $13,800 Gas cost/year $12,048.44 10 yrs bus Salvage value $4,000 Insurance/year $22,200 Maintenance $27,600 Gas cost/year $11,668.20 Specification
Analysis • MARR (15%) • EUAC (Minimize) • Present Worth of Cost (Minimize) • Maximize Benefit Cost Ratio • Sensitivity Analysis
Analysis • 7 year • EUAC= $58,054 • NPW= $235,784.98 • 20 years • 10 year • EUAC= $95,151 • NPW= $67,491.70
Sensitivity analysis • Maintenance • 10 year has to go up by 370% • Fuel and Maintenance • 7 year has to go up by: • Fuel= 300% • Maintenance = 200% • Tax Incentive • 10 year has to go up by 1,333%
Increase Type 7 Gas Inflation by 6% • Increase Type 7 Gas and Maintenance Consumption by 15%
Conclusion • It seems that the 7 year bus is by far the best choice • It would take a lot for the 10 year bus to be the better choice but for some may be the better choice because of aesthetics
Information Gathering • Internet • Public Transit Agencies (RTA, City of Corona, Foothill Transit) • Private Transportation Companies • Bus Manufacturers