Download

1 / 83
830 likes | 983 Vues
2006 Enrollment Retreat. July 24, 2006. Setting The Stage Melanie McClellan. Agenda. 8:30-9:30 Setting the Stage 9:30-9:45 Break 9:45-10:00 Using Data & Narratives to make decisions 10:00-12:00 Students and Programs 12:00-1:00 Lunch. Agenda.

E N D
2006 Enrollment Retreat July 24, 2006
Agenda 8:30-9:30 Setting the Stage 9:30-9:45 Break 9:45-10:00 Using Data & Narratives to make decisions 10:00-12:00 Students and Programs 12:00-1:00 Lunch
Agenda 1:00-2:00 Attracting New Students and Changing the Student Profile 2:00-2:15 Break 2:15-3:00 Enrollment Projections 3:00-4:00 Reflections and Discussions 4:00-4:30 Concluding Comments
Strategic Enrollment Structure Strategic Enrollment Executive Committee Strategic Enrollment Council Task Forces Research and Information First-Year Experience Academic Advising Graduate Enrollment Distance Learning Recruitment & Marketing Communication Core Seat Demand Satellite Campuses Policy, Practices, and Procedures Transfer Students Second Year Exper. Resources
Strategic Enrollment Council • Some Accomplishments • Student Email Policy • Advising Web Site (development) • Collection of information on departmental practices for an Advising Handbook • Foundations of Excellence • Changes in New Student Orientation • Transitions Orientation • Orientation Common Reading • Research on Academic Standing, Withdraw and Retake Policy • Recruitment and Marketing plan • Advising Action Plan
Current Students and ProgramsScot LingrellJulie BartleySandra Stone
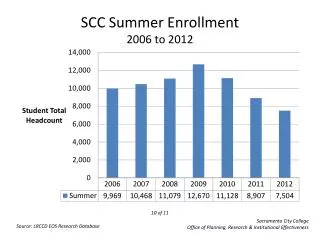
1252 more UGs enrolled than in Fall 2000 +411 +406 +327 +108
New Student Profile • Enrollment (Fall 2005) • 56% of applicants accepted (60% in 2004) • 68% accepts enrolled (56% in 2004) • 1656 FT/FT Freshmen Enrolled (1719 in 2004) • 571 Transfers Enrolled (655 in 2004) • 74 Joint/Academy (67 in 2004) • 30 Transient (25 in 2004) • 61 Learning Support (138 in 2004)
2005 Cohort 60% women 24% African Amer. 87% on HOPE 72% Residential 12.7% Greek 30% in FYRST 18% in UWG 1101 21.5% on Probation after first term 2004 Cohort 58% women 25% African Amer. 81% on HOPE 72% Residential 13.2% Greek 37% in FYRST 8% in UWG 1101 25% on Probation after first term New Student ProfileAll New Freshmen, not just FT/FT
Changing Admission Standards • Affect on Enrollment • Affect on Student Success
New Student Profile 24.5% 25.4% 21.5%
First Year Success and Beyond • How is success measured? • “The numbers”
First Year Success and Beyond • Other measures?
First Year Success and Beyond • Other measures? • May be more difficult to quantify • Often the immediate driving forces of a program • Faculty/staff engagement • Big-picture goals
Retention (1st – 2nd Year) • Fall 2000 through Fall 2005 cohorts • Greeks: • 81% vs. 69% non-Greek ( 0.001) • FYRST: • 76% vs. 68% non-FYRST ( 0.001) • Learning Communities: • 76% vs. 70% non-LC ( 0.001) • UWG 1101 • 70% vs. 70% non-UWG1101 (not significant)
Retention • Overall, retention rates for LCs are higher than non-LC, but highly variable across LCs (1999-2003) • Pre-Health: 81% • Pre-Engineering: 74% • Pre-Nursing: 69% • Making Decisions: 77%
Pre-Health LC 81% Pre-Engineering LC 74% Pre-Nursing LC 69% Making Decisions LC 77% Pre-Health non-LC 70% Pre-Engineering non-LC 67% Pre-Nursing non-LC 69% Undecided non-LC 67% Retention – Know Your Population
Grade Point Averages • Fall 2000 through Fall 2005 cohorts • Greeks: • Cumulative GPA 2.49 vs. 2.25 for non-Greeks ( 0.001) • FYRST: • 1st semester GPA 2.34 vs. 2.27 ( 0.001) • Despite lower HS GPA (2.92 vs. 3.00; 0.001) • LC: • Cumulative GPA 2.46 vs. 2.27 for non-LC ( 0.001) • UWG 1101 (2003-2005): • First-term GPA 2.37 vs. 2.28 for non-UWG (not significant) • Cumulative GPA 2.89 vs. 2.98 for non-UWG (not significant)
GPA – Know Your StudentsPre-Health LC vs. Pre-Health non-LC • F02 Cohort • Year 1: 2.56 vs 2.06 • Year 2: 2.77 vs. 2.57 • Year 3: 2.85 vs. 2.65 • F03 Cohort • Year 1: 2.56 vs. 2.30 • Year 2: 3.01 vs. 2.64 • F04 Cohort • Year 1: 2.16 vs. 2.20
GPA – Know Your StudentsMaking Decisions LC vs. Undecided non-LC • F02 Cohort • Year 1: 2.57 vs. 2.27 • Year 2: 2.52 vs. 2.73 • Year 3: 2.75 vs. 2.79 • F03 Cohort • Year 1: 2.11 vs. 2.27 • Year 2: 2.61 vs. 2.68 • F04 Cohort • Year 1: 2.35 vs. 2.33
So now we have some questions to ask What works, what doesn’t, and why?
Interesting Questions Arise • Possible interpretations?
Interesting Questions Arise • Possible interpretations? • Making Decisions students are retained at a higher rate than non-LC undecided students despite lower GPAs • Connection to college? • Initial preparedness? • MD students have a lower GPA and freshman index than the comparison group • Can we take action?
Academic Standing • UWG 1101 students: • 22% on probation after first semester • 26% of non-UWG 1101 on probation • = 0.001 • Even though GPAs are similar, it looks like the lower end has fewer students. • Engagement in college? • UWG 1101 as “safety net”?
Graduation • Fall 2000 through Fall 2002 Cohorts • Greeks have a 9% higher graduation rate than Non-Greeks ( 0.001) • FYRST students have a 5% higher graduation rate ( 0.001) • Learning Communities have a 3% lower graduation rate ( 0.02)
Graduation • What works [ultimately], and for whom? • Speculation about Greek students
Graduation • What works [ultimately], and for whom? • Speculation about Greek students • Peer support during progression is important • As close friends move closer to graduation, “borderline” students make better decisions about progression. • Does this mean everyone should be Greek? • Not necessarily, but perhaps other progression programs can use similar techniques
Graduation • What works [ultimately], and for whom? • Fall 2001 cohort for LCs • Pre-Engineering LC has a 4% 4-year graduation rate (1 student graduated) • Non-LC group had no students graduate • Success or failure? • Pre-Engineering students comprise 21% of LC students, but only 2% of the non-LC cohort.
Challenge • Use data to begin asking the “hard” questions • What works and what doesn’t work for our students? Which of our students • What should we continue doing, stop doing, or change? • Program-level improvement • Expectation to produce university-level improvement
Qualitative Data • Beyond anecdotes…. • Patterns in student responses • May identify successful and unsuccessful strategies • Can address questions not easily tackled with quantitative data
Student ExperienceQualitative Data • Questionnaires administered during Spring registration • Assess student perceptions of Learning Communities Questions: • Describe how your concept of a Learning Community has changed since first day of class. • Describe any benefits of being in the Learning Community. • Describe any negative outcomes of being in the Learning Community. • Describe how being in a Learning Community has or has not affected your academic work.
Positive ExperiencesSocial Support/Friendship Typical Responses • My concept of a Learning Community has changed because I find myself actually wanting to be involved in my community. I actually look forward to seeing them and working with them as a team. • I like the learning community because you get close to your classmates and are able to form study groups. • You have smaller classes which is good for student/teacher relationships and you always have people to study with. • There’s a constant reminder system…we keep each other in check as far as assignments and readings go.
Positive ExperiencesAcademics • The Learning Community has helped because we discuss our assignments and work together to succeed. • It has helped my work because I have so many resources to ask for help. • By having same professors they tend to get to know you better. They seem to care more.
Negative Experiences Group Conflict • Everyone can get tired of each other. • Can be stuck with people who you don’t like for the entire day. • It is too close knit. Everyone knows everyone’s business. Meeting Others • The only negative outcome of the LC is that we are so isolated with ourselves. It’s hard enough being a freshman and getting to know other people around campus without being isolated. Class Flexibility • You have a limited amount of choices when signing up for classes.
Qualitative Data - Patterns • All comments about academics were positive • Similar comments about social structure in both positive and negative categories • Get to know classmates well… too well?
Where are we? Are we doing it right? NO YES YES Is it the right thing to do? NO Adapted from V. Borden, 2006, presentation to Summer Institute on First-Year Assessment
Common Data, Common Language? • Traditional measures are externally set • Advantage: benchmarking, consistency • Disadvantage: may not show us [internally] what’s most important to us and our mission • Work with the data we have • But recognize diversity by refining measures as appropriate • Set policy at the appropriate scale • University-level • Program-level • Focus on management, rather than solutions