Download
1 / 45
450 likes | 596 Vues
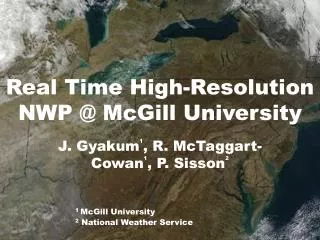
Real Time High-Resolution NWP @ McGill University. J. Gyakum 1 , R. McTaggart-Cowan 1 , P. Sisson 2. 1 McGill University. 2 National Weather Service. Objectives. Implementation of a real time MC2 system Data collection for stat-istical analysis and case studies

E N D
Real Time High-Resolution NWP @ McGill University J. Gyakum1, R. McTaggart-Cowan1, P. Sisson2 1 McGill University 2 National Weather Service
Objectives • Implementation of a real time MC2 system • Data collection for stat-istical analysis and case studies • Investigate impacts of high-resolution modelling on QPF and near-surface winds
Outline • Need for mesoscale modelling • Description of NWP system • Validation case study (27 September 2002) • Project timeline and ongoing upgrades
High Resolution (3km) • Accurate topography • Improved wind fields and fluxes • Model terrain-induced confluence
Mesoscale Orography High resolution (6 km) Degraded resolution (~100 km)
Model Description • MC2 version 4.9.5 • Non-hydrostatic, semi-implicit time step, semi-Lagrangian advection • Full physics version 3.72 • Three one-way nest domains
36 km 12 km 3 km Nesting Strategy
Computational Platform • NEC SX-6/8M10 super-computer maintained by RPN/CMC • 10x8 PE nodes • Theoretical peak performance 10x64 GFlop
Performance Timeline Domain 1 (36km) Domain 2 (12km) Domain 3 (3km) 0000 UTC 0300 UTC 0600 UTC 0900 UTC CMC Regional Forecast McGill Real Time Mesoscale Cascade All runs completed by 0330 Eastern Standard Time
Synoptic Mesoscale Production Suite Traditional upper-level forcings and QG dynamics Visualization of processes and forcings occurring at small scales
Synoptic Production Suite Traditional upper-level forcings and QG dynamics dynamic tropopause potential temperature
Synoptic Production Suite • dynamic tropopause Traditional upper-level forcings and QG dynamics isentropic potential vorticity
Synoptic Production Suite • dynamic tropopause • isentropic potential vorticity Traditional upper-level forcings and QG dynamics coupling index dt - e(bl)
Synoptic Production Suite • dynamic tropopause • isentropic potential vorticity • coupling index Traditional upper-level forcings and QG dynamics moisture transport
Synoptic Production Suite • dynamic tropopause • isentropic potential vorticity • coupling index • moisture transport Traditional upper-level forcings and QG dynamics moisture flux divergence
Synoptic Production Suite • dynamic tropopause • isentropic potential vorticity • coupling index • moisture transport • moisture flux divergence Traditional upper-level forcings and QG dynamics Non-standard synoptic output available on 36 and 12 km domains (1 & 2)
Mesoscale Production Suite Visualization of processes and forcings occurring at small scales frontogenesis function and terms
Mesoscale Production Suite • frontogenesis function Visualization of processes and forcings occurring at small scales high-resolution convective and explicit precip-itation
Mesoscale Production Suite • frontogenesis function • high resolution precipitation Visualization of processes and forcings occurring at small scales high resolution vertical motion fields
Mesoscale Production Suite • frontogenesis function • high resolution precipitation • high resolution vertical motion Visualization of processes and forcings occurring at small scales cross-sectional plots of various thermodynamic variables
Mesoscale Production Suite • frontogenesis function • high resolution precipitation • high resolution vertical motion • thermodynamic cross-sections Visualization of processes and forcings occurring at small scales cross-sectional plots of frontal circulations
Mesoscale Production Suite • frontogenesis function • high resolution precipitation • high resolution vertical motion • thermodynamic cross-sections • frontal circulations Visualization of processes and forcings occurring at small scales Mesoscale visualization tools available on 12 and 3 km domains (2 & 3)
Case Study (2 May) GOES-East Water vapour 0000UTC 2 May
Domain 2 (12 km) Precipitation Structure Radar Observations Model Rain Rate 0900 UTC 2 May 2002 (initialized 0000 1 May)
Domain 2 (12 km) Precipitation Structure Radar Observations Model Rain Rate 1200 UTC 2 May 2002 (initialized 0000 1 May)
March September March September 2002 2003 Project Timeline model implementation McGill-side storage structure analysis tool construction visualization design web interface construction gridded data transfers AWIPS implementation real time modelling completed in progress planned
Case Study (27 Sept) GOES-East Water vapour (0000 UTC 27 Sept)
Precipitation Domain 1 (36km) total 24 hour rainfall ending 1200 UTC 28 Sept
Precipitation Observed total 24 hour rainfall ending 1200 UTC 28 Sept
Precipitation Domain 2 (12km) total 24 hour rainfall ending 1200 UTC 28 Sept
Precipitation Domain 3 (3km) total 24 hour rainfall ending 1200 UTC 28 Sept
Precipitation Domain 3 (3km) total 24 hour rainfall ending 1200 UTC 28 Sept
Dynamic Tropopause McGill 24h forecast RUC analysis 00Z 28 Potential Temperature
Project Timeline model implementation McGill-side storage structure analysis tool construction web interface construction visualization design real time modelling March June September December 2002 2003 completed in progress planned
Radar Imagery 0814 UTC 31 March
IBL Development YUL BTV Lake Champlain
Summary • Implementation of real time mesoscale NWP is under way at McGill • High resolution (3 km) will enhance mesoscale flow and QPF forecasts for the St. Lawrence / NE states region
Data Access • http://132.206.43.151:5080 • Grib files available to ftp servers upon request to: rmctc@zephyr.meteo.mcgill.ca