Overview of Foreign-Born Populations in Maryland: Trends, Impact, and Future Directions
650 likes | 785 Vues
This comprehensive report presented to the Maryland Coalition for Refugees and Immigrants delves into the statistics and trends associated with foreign-born residents in Maryland from U.S. Census data. It highlights total and recent arrivals, their impact on population growth, language proficiency (particularly those who speak English "less than very well"), and sub-county data. Additionally, the report discusses migration trends by decade and anticipates future developments in Maryland’s demographic landscape.

Overview of Foreign-Born Populations in Maryland: Trends, Impact, and Future Directions
E N D
Presentation Transcript
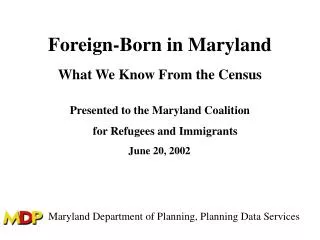
Foreign-Born in Maryland Presented to the Maryland Coalition for Refugees and Immigrants June 20, 2002 What We Know From the Census Maryland Department of Planning, Planning Data Services
Foreign-Born in Maryland • Total and Recent Arrivals • Impact on Population Growth • Speak English “Less Than Very Well” • Sub-County Data (places) • What is Coming in the near future • MDP WEB Page
Total Foreign Born in Maryland Prepared by the Maryland Department of Planning, from U.S. Census data
Foreign Born as a Pct of Total Population in Maryland Prepared by the Maryland Department of Planning, from U.S. Census data
Foreign-Born Entering Maryland by Decade Prepared by the Maryland Department of Planning, from U.S. Census data
Where Foreign-Born Entered During the 1980s Prepared by the Maryland Department of Planning, from U.S. Census data
“Rest” of the 1980s Prepared by the Maryland Department of Planning, from U.S. Census data
Where Foreign-Born Entered During the 1990s Prepared by the Maryland Department of Planning, from U.S. Census data
“Rest” of the 1990s Prepared by the Maryland Department of Planning, from U.S. Census data
Foreign Born in Maryland Entered 1990-2000 Prepared by the Maryland Department of Planning, from U.S. Census data
Foreign Born in Maryland by Jurisdiction – 2000 Prepared by the Maryland Department of Planning, from U.S. Census data
Foreign Born as a Percent of Total Population – 2000 Prepared by the Maryland Department of Planning, from U.S. Census data
Foreign-Born in Maryland • Total and Recent Arrivals • Impact on Population Growth • Speak English “Less Than Very Well” • Sub-County Data • What is Coming in the Near Future • MDP WEB Page
Components of Population Change, 1990 – 2000, Maryland Prepared by the Maryland Department of Planning, from U.S. Census data
Components of Migration for Maryland, 1990 – 2000 Prepared by the Maryland Department of Planning, from U.S. Census data
Components of Migration for Montgomery County, 1990 – 2000 Prepared by the Maryland Department of Planning, from U.S. Census data
Components of Migration for Prince George’s County, 1990 – 2000 Prepared by the Maryland Department of Planning, from U.S. Census data
Components of Migration for Baltimore City, 1990 – 2000 Prepared by the Maryland Department of Planning, from U.S. Census data
Components of Migration for Baltimore County, 1990 – 2000 Prepared by the Maryland Department of Planning, from U.S. Census data
Components of Migration for Howard County, 1990 – 2000 Prepared by the Maryland Department of Planning, from U.S. Census data
Foreign Immigration as a Percent of Total Population Gain Prepared by the Maryland Department of Planning, from U.S. Census data
Population Change for Maryland by Race/Hispanic Origin, 1990 – 2000 * * Race for 2000 includes single race only Prepared by the Maryland Department of Planning from U.S. Census Data
Population Growth – Asians, 1990-2000 Prepared by the Maryland Department of Planning from U.S. Census Data
Population Growth – Hispanics, 1990-2000 Prepared by the Maryland Department of Planning from U.S. Census Data
Foreign-Born in Maryland • Total and Recent Arrivals • Impact on Population Growth • Speak English “Less Than Very Well” • Sub-County Data • What is Coming in the Near Future • MDP WEB Page
Number in Maryland Who Speak English “Less Than Very Well” Prepared by the Maryland Department of Planning, from U.S. Census data
No. in Maryland Who Speak English “Less Than Very Well” by Native Language - 2000 47.0% 48.5% 29.5% Prepared by the Maryland Department of Planning, from U.S. Census data
Number Who Speak English, “Less Than Very Well” – 2000 Prepared by the Maryland Department of Planning, from U.S. Census data
Pct Who Speak English, “Less Than Very Well” – 2000 Prepared by the Maryland Department of Planning, from U.S. Census data
Foreign-Born in Maryland • Total and Recent Arrivals • Impact on Population Growth • Speak English “Less Than Very Well” • Sub-County Data – (Places) • What is Coming in the Near Future • MDP WEB Page
Foreign Born in Maryland by Place - 2000 Prepared by the Maryland Department of Planning, from U.S. Census data
Foreign Born, Baltimore-Washington Region, by Place - 2000 Prepared by the Maryland Department of Planning, from U.S. Census data
Foreign Born, Montgomery & P.G. counties, by Place - 2000 Prepared by the Maryland Department of Planning, from U.S. Census data
Total Foreign Born By Place – 2000 Prepared by the Maryland Department of Planning, from U.S. Census data
Foreign Born as a Percent of the Total Population, by Place - 2000 Prepared by the Maryland Department of Planning, from U.S. Census data
Foreign Born as a Percent of the Total Population, Balt-Wash area by Place - 2000 Prepared by the Maryland Department of Planning, from U.S. Census data
Foreign Born as a Pct of Total Pop, by Place, Montgomery & P.G. counties - 2000 Prepared by the Maryland Department of Planning, from U.S. Census data
Foreign Born as a Percent of Total Population for Places – 2000 Prepared by the Maryland Department of Planning, from U.S. Census data
Foreign Born, Entered 1990 – 2000, By Place Prepared by the Maryland Department of Planning, from U.S. Census data
Foreign Born, Entered 1990-2000, Baltimore-Wash., by Place Prepared by the Maryland Department of Planning, from U.S. Census data
Foreign Born, Entered 1990-2000, Mont & P.G., by Place Prepared by the Maryland Department of Planning, from U.S. Census data
Foreign Born, Entered 1990 – 2000, by Place Prepared by the Maryland Department of Planning, from U.S. Census data
Percent of Foreign Born Who Entered 1990-2000, by Place Prepared by the Maryland Department of Planning, from U.S. Census data
Percent of Foreign Born Who Entered 1990-2000, by Place Prepared by the Maryland Department of Planning, from U.S. Census data
Percent of Foreign Born Who Entered 1990-2000, Mont & P.G., by Place Prepared by the Maryland Department of Planning, from U.S. Census data
Pct. Foreign Born, Entered 1990-2000, by Place Prepared by the Maryland Department of Planning, from U.S. Census data
Number of People Who Speak English, “Less Than Very Well,” by Place - 2000 Prepared by the Maryland Department of Planning, from U.S. Census data
No. of People Who Speak English, “Less Than Very Well,” Balt-Wash, by Place
No. of People Who Speak English, “Less Than Very Well,” Mont & P.G., by Place Prepared by the Maryland Department of Planning, from U.S. Census data
Number Who Speak English, “Less Than Very Well,”by Place – 2000 Prepared by the Maryland Department of Planning, from U.S. Census data