Understanding Quartiles, Interquartile Range, and Box-and-Whisker Plots in Statistics
This guide explores key concepts in statistics, focusing on quartiles, interquartile range (IQR), and graphical representation of data using box-and-whisker plots. You'll learn how to determine the first, second, and third quartiles from a data set, calculate the IQR, and represent data visually. Additionally, it covers the interpretation of other fractiles, such as percentiles. Real-life examples, including sales data analysis, help reinforce these concepts. Complete the assigned exercises to solidify your understanding and prepare for upcoming assessments.

Understanding Quartiles, Interquartile Range, and Box-and-Whisker Plots in Statistics
E N D
Presentation Transcript
Section 2.5 Measures of Position Statistics Mrs. Spitz Fall 2008
How to find the first, second and third quartiles of a data set. How to find the interquartile range of a data set How to represent a data set graphically using a box-and-whisker plot How to interpret other fractiles such as percents Assignment: pp78-82 #1-32 all – Due Wednesday Chapter 2 Review pp. 97-100 #1-45 all Due Friday Chapter 2 Test – Friday – Binder Check with notes due FRIDAY. Objectives/Assignment
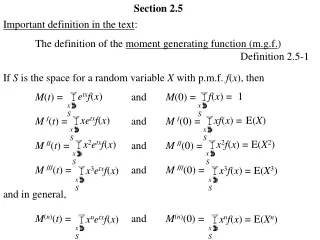
Fractiles are numbers that partition or divide an ordered data set into equal parts. For instance, the median is a fractile because it divides an ordered data set into two equal parts. The thre quartiles Q1, Q2 and Q3 approximately divide an ordered data set into four equal parts. About one quarter of the data falls on or below the first quartiles, Q1. About one half of the data alls on or below the second quartile Q2, and about three quarters of the data falls on or below the third quartile Q3. The second quartile is the same as the median of the data set. Definitions
The interquartile range (IQR) of a data set is the difference between the first and third quartiles. Interquartile range (IQR)= Q3 – Q1 Definitions
Quartiles 3 quartiles Q1, Q2 and Q3 divide the data into 4 equal parts. Q2 is the same as the median. Q1 is the median of the data below Q2. Q3 is the median of the data above Q2. You are managing a store. The average sale for each of 27 randomly selected days in the last year is given. Find Q1, Q2,and Q3. 28 43 48 51 43 30 55 44 48 33 45 37 37 42 27 47 42 23 46 39 20 45 38 19 17 35 45
Finding Quartiles The data in ranked order (n = 27) are: 17 19 20 23 27 28 30 33 35 37 37 38 39 42 42 43 43 44 45 45 45 46 47 48 48 51 55. Median rank (27 + 1)/2 = 14. The median = Q2 = 42. There are 13 values below the median. Q1 rank= 7. Q1 is 30. Q3 is rank 7 counting from the last value. Q3 is 45. The Interquartile Range is Q3 – Q1 = 45 – 30 = 15.
Box and Whisker Plot A box and whisker plot uses 5 key values to describe a set of data. Q1, Q2 and Q3, the minimum value and the maximum value. Q1 Q2 = the median Q3 Minimum value Maximum value 30 42 45 17 55 42 45 30 17 55 15 25 35 45 55 Interquartile Range = 45 – 30 = 15
Percentiles Percentiles divide the data into 100 parts. There are 99 percentiles: P1, P2, P3…P99. P50 = Q2 = the median P25 = Q1 P75 = Q3 A 63rd percentile score indicates that score is greater than or equal to 63% of the scores and less than or equal to 37% of the scores.
Percentiles Cumulative distributions can be used to find percentiles. 114.5 falls on or above 25 of the 30 values. 25/30 = 83.33. So you can approximate 114 = P83.