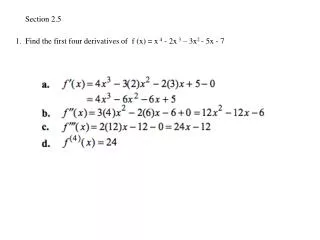
Section 2.5
Section 2.5. Measures of Position. Section 2.5 Objectives. Determine the quartiles of a data set Determine the interquartile range of a data set Create a box-and-whisker plot Interpret other fractiles such as percentiles Determine and interpret the standard score ( z- score). Quartiles.

Section 2.5
E N D
Presentation Transcript
Section 2.5 Measures of Position
Section 2.5 Objectives • Determine the quartiles of a data set • Determine the interquartile range of a data set • Create a box-and-whisker plot • Interpret other fractiles such as percentiles • Determine and interpret the standard score (z-score)
Quartiles • Fractiles are numbers that partition (divide) an ordered data set into equal parts. • Quartiles approximately divide an ordered data set into four equal parts. • First quartile, Q1: About one quarter of the data fall on or below Q1. • Second quartile, Q2: About one half of the data fall on or below Q2 (median). • Third quartile, Q3: About three quarters of the data fall on or below Q3.
Example: Finding Quartiles The test scores of 15 employees enrolled in a CPR training course are listed. Find the first, second, and third quartiles of the test scores. 13 9 18 15 14 21 7 10 11 20 5 18 37 16 17 Lower half Upper half Q2 • Solution: • Q2 divides the data set into two halves. 5 7 9 10 11 13 14 15 16 17 18 18 20 21 37
Solution: Finding Quartiles • The first and third quartiles are the medians of the lower and upper halves of the data set. 5 7 9 10 11 13 14 15 16 17 18 18 20 21 37 Upper half Lower half Q2 Q1 Q3 About one fourth of the employees scored 10 or less, about one half scored 15 or less; and about three fourths scored 18 or less.
Interquartile Range Interquartile Range (IQR) • The difference between the third and first quartiles. • IQR = Q3 – Q1
Example: Finding the Interquartile Range Find the interquartile range of the test scores. Recall Q1 = 10, Q2 = 15, and Q3 = 18 • Solution: • IQR = Q3 – Q1 = 18 – 10 = 8 The test scores in the middle portion of the data set vary by at most 8 points.
Box-and-Whisker Plot Box-and-whisker plot • Exploratory data analysis tool. • Highlights important features of a data set. • Requires (five-number summary): • Minimum entry • First quartile Q1 • Median Q2 • Third quartile Q3 • Maximum entry
Drawing a Box-and-Whisker Plot • Find the five-number summary of the data set. • Construct a horizontal scale that spans the range of the data. • Plot the five numbers above the horizontal scale. • Draw a box above the horizontal scale from Q1 to Q3 and draw a vertical line in the box at Q2. • Draw whiskers from the box to the minimum and maximum entries. Box Whisker Whisker Minimum entry Maximum entry Q1 Median, Q2 Q3
Example: Drawing a Box-and-Whisker Plot Draw a box-and-whisker plot that represents the 15 test scores. Recall Min = 5 Q1 = 10 Q2 = 15 Q3 = 18 Max = 37 Solution: 5 10 15 18 37 About half the scores are between 10 and 18. By looking at the length of the right whisker, you can conclude 37 is a possible outlier.
More about Percentiles The median divides the lower 50% of a set of data from the upper 50% of a set of data. In general, the kth percentile, denoted Pk , of a set of data divides the lower k% of a data set from the upper (100 – k) % of a data set.
Computing the kth Percentile, Pk Step 1:Arrange the data in ascending order. Step 2: Compute an index i using the following formula: where k is the percentile of the data value and n is the number of individuals in the data set. Step 3: (a) If i is not an integer, round up to the next highest integer. Locate the ith value of the data set written in ascending order.This number represents the kth percentile. (b) If i is an integer, the kth percentile is the arithmetic mean of the ith and (i + 1)st data value.
Example: Finding Percentiles The test scores of 15 employees enrolled in a CPR training course are listed. 13 9 18 15 14 21 7 10 11 20 5 18 37 16 17 Find the (a) 75th percentile (b) 35th percentile
Finding the Percentile that Corresponds to a Data Value Step 1: Arrange the data in ascending order. Step 2: Use the following formula to determine the percentile of the score, x: Percentile of x= Round this number to the nearest integer.
Example: Finding Percentiles The test scores of 15 employees enrolled in a CPR training course are listed. 13 9 18 15 14 21 7 10 11 20 5 18 37 16 17 Find the percentile rank of the data value 13.
Example: Interpreting Percentiles The ogive represents the cumulative frequency distribution for SAT test scores of college-bound students in a recent year. What test score represents the 72nd percentile? How should you interpret this? (Source: College Board Online)
Solution: Interpreting Percentiles The 72nd percentile corresponds to a test score of 1700. This means that 72% of the students had an SAT score of 1700 or less.
The Standard Score Standard Score (z-score) • Represents the number of standard deviations a given value x falls from the mean μ.
Example: Comparing z-Scores from Different Data Sets In 2007, Forest Whitaker won the Best Actor Oscar at age 45 for his role in the movie The Last King of Scotland. Helen Mirren won the Best Actress Oscar at age 61 for her role in The Queen. The mean age of all best actor winners is 43.7, with a standard deviation of 8.8. The mean age of all best actress winners is 36, with a standard deviation of 11.5. Find the z-score that corresponds to the age for each actor or actress. Then compare your results.
Solution: Comparing z-Scores from Different Data Sets • Forest Whitaker 0.15 standard deviations above the mean • Helen Mirren 2.17 standard deviations above the mean
Solution: Comparing z-Scores from Different Data Sets z = 0.15 z = 2.17 The z-score corresponding to the age of Helen Mirren is more than two standard deviations from the mean, so it is considered unusual. Compared to other Best Actress winners, she is relatively older, whereas the age of Forest Whitaker is only slightly higher than the average age of other Best Actor winners.
Practice Questions Q (2.15) Given the following data set. Data: 78, 82, 86, 88, 92, 97 (a) Find the percentile rank for each of the values 86 & 92. (b)Find the data value corresponding to the 30th percentile.
Practice Questions Q (2.16) Identify the five number summary and find the Interquartile range. Data: 6, 8, 12, 19, 27, 32, 54
50 55 60 65 70 75 80 85 90 95 100 Practice Questions Q (2.17) Use the box plot to identify minimum value, maximum value, first quartile, Median (second quartile), and third quartile.
Section 2.5 Summary • Determined the quartiles of a data set • Determined the interquartile range of a data set • Created a box-and-whisker plot • Interpreted other fractiles such as percentiles • Determined and interpreted the standard score(z-score)