Download
1 / 20
200 likes | 430 Vues
Create an experiment in PsychoPy to examine the Simon Effect. When you first run PsychoPy (v 1.78), the display will look like this:. Right-click on the colored box and remove it. Adjust the preferences. Change the text to “+”. Add a text object. Clear the duration. .

E N D
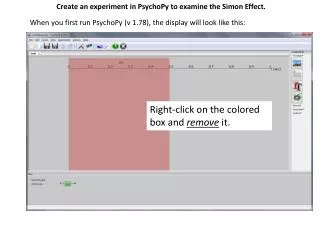
Create an experiment in PsychoPy to examine the Simon Effect. When you first run PsychoPy (v 1.78), the display will look like this: Right-click on the colored box and remove it.
Change the text to “+”. Add a text object. Clear the duration.
Save the PsychoPy file. Create an excel file in the same folder with the variables that will specify attributes of the stimuli. Enter the variables and values shown below. Give the file a meaningful name. Maybe simonloop.xlsx. Save the file.
Insert a loop in the flow at the bottom of the screen. Call it “trials”. Browse to the file you created in the previous step and select it.
Add a column to your Excel spreadsheet called “correctresponse”. Enter the correct values. Be sure to save the file. Note that you should press the Z key in response to red, and the slash key in response to green. Now run the experiment. Take a look at the data file.
To facilitate analysis, add a “condition” field to the excel spreadsheet. Run the experiment again.
Open the data file. Insert a pivot table and set the fields as shown below. For “fun” try dragging something else here such as targetcolor or targetx Change this setting to include only correct trials (value = 1).
Add a break after each block. Create a new routine called “pause” (“break” is a protected word). Insert the pause after the trial loop Select the pause routine and add a text object.
Now add a keyboard object to the pause routine. PsychoPy will wait for a keypress before ending the break. We now have one block of four trials. Run the experiment to test it.
We need more blocks. Now put everything in another loop. Call it “blocks”. For now, just specify two repetitions (two blocks). Run the experiment again.
Lets add some feedback. Insert a new routine called “feedback” into the trials loop as shown below.
Select the feedback routine. Insert a text object as shown below.
Now insert a “code” object into the feedback routine. Right click on code and make it the first object in the routine:
Test your experiment. You should have two blocks of four trials each with a break after each block. You should receive feedback when you make an incorrect response.
Now add enough repetitions so we have a complete experiment. Thirty trials per “cell” is a good target. Set 6 repetitions of the trials loop and five repetitions of the blocks loop. Run the experiment. We’ll be analyzing the data so try to be as fast as possible without making too many errors! Remember: Red = Z Green = /