Download
1 / 80
800 likes | 932 Vues
Australian National Centre for Latin American Studies (ANCLAS) Third Annual Conference. The International Oil Price Boom in Latin America: Bolivia, Chile, Colombia, Mexico, Nicaragua and Venezuela. Mauricio Medinaceli Monrroy. September, 2013. List of Topics. Selection of Countries

E N D
Australian National Centre for Latin American Studies (ANCLAS) Third Annual Conference The International Oil Price Boom in Latin America: Bolivia, Chile, Colombia, Mexico, Nicaragua and Venezuela Mauricio Medinaceli Monrroy September, 2013
List of Topics Selection of Countries GDP and per capita GDP growth Model and Results Case Study: Bolivia Main Conclusions
List of Topics Selection of Countries GDP and per capita GDP growth Model and Results Case Study: Bolivia Main Conclusions
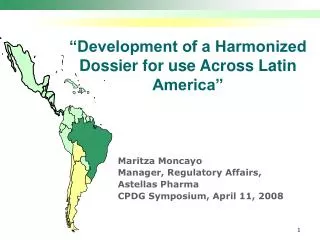
Selection of Countries Why this Countries? Mexico Nicaragua Venezuela Colombia Bolivia Export Countries Chile Import Countries
Selection of Countries Hypothesis Oil Boom International Prices have different economic impact over countries in Latin America
List of Topics Selection of Countries GDP and per capita GDP growth Model and Results Case Study: Bolivia Main Conclusions
GDP & Per Capita GDP GDP Growth
GDP & Per Capita GDP GDP Growth
GDP & Per Capita GDP GDP Growth
GDP & Per Capita GDP GDP Growth
GDP & Per Capita GDP Per Capita GDP Growth
List of Topics Selection of Countries GDP and per capita GDP growth Model and Results Case Study: Bolivia Main Conclusions
Model and Results Variables K/GDP G/GDP
Model and Results Variables (X+M)/GDP TT/GDP
Model and Results Variables Illiteracy Rate Devaluation
Model and Results Variables USA GDP Growth China GDP Growth
Model and Results Variables Prices Imports
Model and Results WTI Price and Per Capita GDP Growth
Model and Results WTI Price and Per Capita GDP Growth
Model and Results WTI Price and Per Capita GDP Growth
Model and Results WTI Price and Per Capita GDP Growth
Model and Results WTI Price and Per Capita GDP Growth Not very conclusive, what we can do?
Model and Results WTI Price and Per Capita GDP Growth Semi Non Parametric relation
Model and Results WTI Price and Per Capita GDP Growth
Model and Results WTI Price and Per Capita GDP Growth The positive relation between GDP growth and oil prices, for producer countries, is always good?
List of Topics Selection of Countries GDP and per capita GDP growth Model and Results Case Study: Bolivia Main Conclusions
Case Study: Bolivia Markets for Bolivian Natural Gas
Case Study: Bolivia Natural Gas Export Prices
Case Study: Bolivia Royalties and ProductionTax
Case Study: Bolivia “Cake” Division in Upstream
Case Study: Bolivia Micro – Macro Model Results
Case Study: Bolivia Micro – Macro Model Results
Case Study: Bolivia Micro – Macro Model Results
Case Study: Bolivia Micro – Macro Model Results
Case Study: Bolivia Why? The logic behind is as follows: More demand from Brazil and Argentina associated with high international prices, generates an increase in Bolivian natural gas exports More export value generates more natural gas production value That generates more fiscal revenues from royalties and production taxes Because of current law, more fiscal resources increase the internal demand for construction, transport and formal services An increase in the internal demand generates inflation More inflation generates a decrease in the real income of people who don't participate directly of the hydrocarbons sector, this, at the end, increase global poverty and inequality
List of Topics Selection of Countries GDP and per capita GDP growth Model and Results Case Study: Bolivia Main Conclusions
Case Study: Bolivia Why? Not all the countries in LAC are the same Producer countries really benefits from oil price boom A high oil price generates a GDP growth in Producer Countries A high oil price generates a GDP decrease in Import Countries Not always a high GDP generates good social indicators
Energy Consumption How to read the Figure? High GDP High energy consumption High GDP Low energy consumption Per Capita GDP Low GDP High energy consumption Low GDP Low energy consumption Per Capita Energy Consumption
Energy Consumption 1970 Sizedepends of population Uruguay Colombia Argentina Venezuela Ecuador México Bolivia Chile Perú Brasil Guatemala Paraguay
Energy Consumption 1970
Energy Consumption 1971
Energy Consumption 1972
Energy Consumption 1973
Energy Consumption 1974
Energy Consumption 1975
Energy Consumption 1976
Energy Consumption 1977
Energy Consumption 1978
Energy Consumption 1979
Energy Consumption 1980