Download
1 / 1
10 likes | 139 Vues
Observations of Total Peroxy Nitrates during TOPSE. J. A. Thornton 1 , P. J. Wooldridge 1 , D. A. Day 1 , R. S. Rosen 1 , R. C. Cohen 1 , F. Flocke 2 , A. Weinheimer 2 , B. A. Ridley 2 Email: cohen@cchem.berkeley.edu

E N D
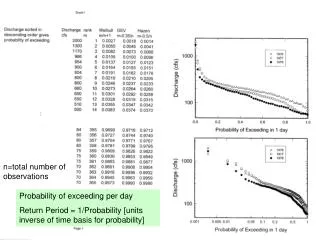
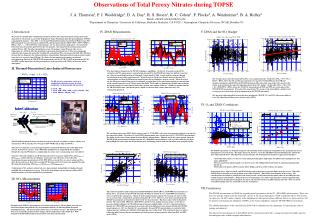
Observations of Total Peroxy Nitrates during TOPSE J. A. Thornton1, P. J. Wooldridge1, D. A. Day1, R. S. Rosen1, R. C. Cohen1, F. Flocke2, A. Weinheimer2, B. A. Ridley2 Email: cohen@cchem.berkeley.edu 1 Department of Chemistry; University of California, Berkeley; Berkeley, CA 94720; 2 Atmospheric Chemistry Division, NCAR; Boulder CO • Introduction • We present in-situ high time resolution measurements of NO2 and total peroxynitrate mixing ratios made aboard the C-130 aircraft as part of the Tropospheric Ozone Production about the Spring Equinox (TOPSE) campaign from January – May 2000. A two channel Thermal Dissociation Laser Induced Fluorescence (TD-LIF) instrument was used to measure ambient NO2 and total peroxynitrate (PAN PAN + PPN + MPAN + HNO4 + N2O5 + …+ RC(O)OONO2) concentrations. Air was drawn from a single point ~ 18 cm from the belly of the aircraft and then split between the two channels. One channel of the instrument measured ambient NO2 by LIF. The other channel had an oven (30 cm long x 6 mm OD pyrex tube) set at a temperature of ~ 450 K to effect the quantitative conversion of peroxynitrates to NO2 and a companion radical. In this channel, the sum of the resulting NO2 and ambient NO2 was measured by LIF. The difference between the two channels is the total peroxynitrate concentration. Total peroxynitrate concentrations ranged from near zero to greater than 1500 ppt. We discuss the instrument’s performance, an informal intercomparison between the TDLIF PAN measurements and the NCAR GC-ECD measurements of PAN and PPN, and the importance of other peroxynitrates such as pernitric acid (HNO4) in the arctic winter troposphere. IV. PAN Measurements V. PAN and the NOy Budget II. Thermal-Dissociation Laser-Induced Fluorescence The above figures demonstrate the TD-LIF technique’s capabilities. On the left, 12-second average PAN (triangles) and NO2 (open squares) concentrations measured by the TD-LIF instrument are plotted versus time for a local research flight based out of Churchill, Canada April 11, 2000. Arrows indicate when the thermal dissociation oven was either turned on or off. When the oven is off, the two channels measure the same NO2 concentrations, and thus the difference in signal between the two channels is zero on average. When the oven is on, the difference in signal between the two channels is proportional to the sum total peroxynitrate concentration which ranged from near zero to 750 ppt during this flight. To the right, we demonstrate the high time resolution by showing the the 12-second average data from a narrow time window (56500 sec – 62500 sec) together with the NCAR (PAN+PPN) data (solid black squares) which was measured on a slower time interval by Gas Chromatography ECD. XNO2 + heat X + NO2 The two plots above show the ratio of NOyi/NOy versus ambient pressure. On the left, NOyi = NO + NO2 + PAN + HNO3, where the NO and NO2 measurements were made by NCAR, HNO3 by the UNH mist chamber instrument, and PAN by the TD-LIF instrument. The ratio of the sum of these NOy species to the total is scattered about the value of 1 indicating closure in the NOy budget. On the right, NOyi = NO + NO2 + GC_(PAN+PPN) + HNO3, where the NCAR GC measurements of PAN and PPN are used in place of the TD-LIF PAN measurements. The ratio of the sum of these NOy species to the total exhibits a similar trend versus pressure as that observed in the comparison to the TD-LIF instrument. The apparent calibration offset between the three instruments (TD-LIF, GC, total NOy) affects our ability to assess the abundance of other peroxy nitrates such as HNO4. The NO2 yield vs. temperature curve for a combination of different classes of nitrate compounds can be predicted and measured. T< 325 K NO2 T~ 500 K PAN + PPN + HNO4 + N2O5 + RO2NO2 + NO2 T~ 650 K RONO2 + RO2NO2 + NO2 VI. O3 and PAN Correlations Inlet/Calibration Inlet/Calibration PAN source Zero Gas PFA Teflon Manifold Oven: 1/4”diameter, 25 cm long pyrex tube wrapped in nichrome wire for heating. Sampling Cooling Section Cooling Section Calibrating Calibrating ~ 3m of tubing To LIF To LIF & Zeros & Zeros Cell 2 Cell 2 Pinholes to reduce pressure (increased flow rate) Premixed NO2 Calibration Gas The two figures above show PAN (black squares) and GC_(PAN+PPN) (red circles) measurements plotted versus time for two consecutive flights. Up to three 12-second PAN measurements were averaged to each GC_(PAN+PPN) measurement. The flights are the same as those shown in section III NO2 Measurements. Flight 40, on the left, shows periods where the TD-LIF PAN measurements are higher than the GC_(PAN+PPN) measurements as well as periods when they are lower. During Flight 41, on the right, the measurements agree well during periods when concentrations were changing rapidly. To LIF - Cell 1 • The TD-LIF instrument fit into a standard research aircraft rack (see photo), weighed ~ 200 kg, and consumed 1.1 kW of aircraft power (4 Amps of 110V 400 Hz and 23 Amps of 28V DC). • The inlet (see schematic) was located approximately 3 m from the detection axis at the belly of the aircraft. It consists of a small (~ 9 cm3) PFA teflon manifold. Air is sampled from the manifold through two separate PFA lines by a combination of a rotary vane vacuum pump and a roots blower. • One line is directed straight to an LIF detection cell (Cell 1) to measure ambient NO2 ([NO2]signal_1 = [NO2]ambient), and the other passes through a 25 cm long, 6 mm OD pyrex oven to affect the dissociation of organic peroxynitrates (PAN, PPN, HNO4, etc) and N2O5 to a sister radical and NO2. After the oven, the gas is directed to a second LIF detection cell (Cell 2) to measure ambient NO2 plus NO2 from the dissociation ([NO2]signal_2 = [NO2]ambient + [NO2]ROONO2+Heat). • Calibrations to NO2 and zero artifact tests were done routinely during flights by flooding the inlet manifold with a gas mixture or zero air. Tests of the dissociation oven were done by adding a PAN standard mixture to the inlet manifold between missions. • The TOPSE experiment was designed to improve our knowledge of the mechanisms responsible for the springtime increase in tropospheric O3 over the Arctic. The figure above, left, shows O3 versus the LIF PAN concentration binned by altitude for data collected north of 50. The importance of separating the role of mixing from chemistry is apparent in this figure : • Above 6km (blue circles), we observe recent mixing of stratospheric (high ozone, low PAN) and tropospheric air (low ozone, high PAN) • Between 2 and 5 km (black triangles), we observe layers with 1600ppt PAN and 75 ppb O3 indicating mixing of mid latitude air. • Below 2km (red squares), PAN is mostly below 400ppt, and there is little evidence for mixing. • In the figure above, right, we plot O3 and PAN mixing ratios averaged over an entire flight versus day of year. When TD-LIF PAN measurements were not available we used the NCAR GC_(PAN+PPN) measurements in the average. The correlated increase of both O3 and PAN in the Arctic provide a strong constraint for models aimed at describing the roles of both transport and chemistry. While the increase in tropospheric O3 as observed in the figure could be explained solely from an increase in mixing of stratospheric air masses, the correlated increase in PAN mixing ratios (R2 = 0.63) can not be since PAN mixing ratios are essentially zero in the stratosphere. III. NO2 Measurements VII.Conclusions The results of a point-by-point comparison of all TD-LIF PAN and NCAR GC_(PAN+PPN) measurements are shown above. 12-second average TD-LIF data that fell within 36 seconds of a GC_(PAN+PPN) measurement were averaged for the comparison. A linear fit to the comparison data suggests the two data sets agree to with 4% on average with a 1.6 ppt offset and good correlation (R2 = 0.77). However, at the lower concentrations the TD-LIF measurements are biased low relative to the GC measurements. This bias is also evident in the plot to the left. The ratio of LIF_ PAN/GC_(PAN+PPN) is plotted versus ambient pressure (mbar). At the lowest pressures (highest altitudes), the TD-LIF instrument measures slightly higher (~10-15%) total peroxynitrates than the GC_(PAN+PPN) measurements on average, and at the highest pressures (lowest altitudes) the TD-LIF measurements are ~30% less than the GC measurements. Because PAN concentrations are correlated with ambient pressure (altitude), it is difficult to determine the cause of this trend. The trend maybe due to a relative calibration offset between the two instruments and to the presence of peroxynitrates other than PAN and PPN such as HNO4. The TD-LIF measurements of PAN are in good general agreement with the GC_(PAN+PPN) measurements. These two data sets provide evidence that the major NOy species in the Arctic troposphere is PAN. Calibration offsets between the two data sets (10-30%) make estimates of the abundance of other peroxynitrates difficult. However, future analysis will be aimed at constraining the abundance of HNO4 in the Arctic troposphere using the TD-LIF PAN measurements. The altitude dependence to the correlation of PAN with O3 demonstrates the importance of separating the roles of mixing and chemistry. The observed seasonal increase of both PAN and O3 concentrations provides a strong constraint for models aimed at describing the roles of both transport and chemistry. Examples of the LIF NO2 measurements (red circles) made on the C-130 are shown above for two consecutive flights along with the NO2 measurements made by NCAR using Photo-Fragment Chemiluminescence. The measurements shown here are 1-minute averages. The LIF and NCAR NO2 are in reasonable agreement above 10 ppt, and the comparison is noisy below that. Both channels in the TD-LIF instrument measured the same NO2 concentrations.