Understanding Low Flow Statistics and Recurrence Intervals in Hydrogeology
This article explores the concepts of low flow statistics, specifically 7Q2, 7Q10, and 30Q10, which represent the low flow occurrences over different durations and recurrence intervals. It examines the probabilities associated with exceeding flow rates over specific time intervals, using formulas to calculate the likelihood of certain flows and storms based on their recurrence intervals. By analyzing these probabilities, we can gain insights into the hydrogeological conditions and behavior of water systems, essential for water resource management and ecological sustainability.

Understanding Low Flow Statistics and Recurrence Intervals in Hydrogeology
E N D
Presentation Transcript
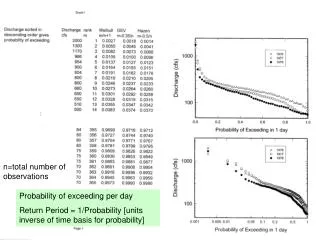
n=total number of observations Probability of exceeding per day Return Period = 1/Probability [units inverse of time basis for probability]
Low flow statistics often reported as 7Q2= 7 day low flow w/ 2 year recurrence interval 7Q10=7 day low flow w/ 10 year recurrence interval 30Q10=30 day low flow w/ 10 year recurrence interval
Probability that a flow with a certain recurrence interval (t) will occur once in a given time interval (n) P=1-(1-(1/t))n Probability that a storm with a 3 year recurrence interval will occur once in 7 days Recurrence interval=3 years = 1095 days P=1-(1-(1/1095))7=0.0063
What can you infer about the hydrogeology from the different discharge probability plots?