PELP1 Knockdown Enhances Cell Survival in Cancer Models
Study on the impact of PELP1 knockdown on cell survival in cancer models using various treatments and molecular assays. Results show PELP1 depletion affects cell response to different stressors.

PELP1 Knockdown Enhances Cell Survival in Cancer Models
E N D
Presentation Transcript
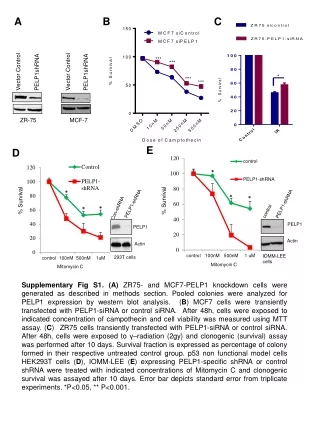
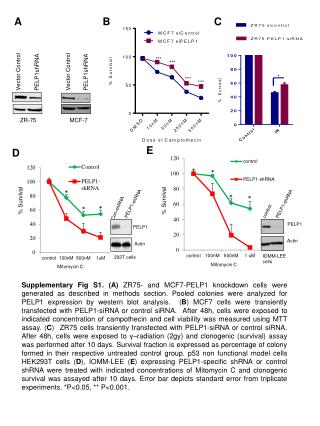
A B C PELP1-shRNA control PELP1 PELP1shRNA Vector Control Vector Control PELP1shRNA Actin Con-shRNA ZR-75 MCF-7 PELP1 E D Actin * % Survival * * * PELP1-shRNA % Survival * * IOMM-LEE cells 293T cells Mitomycin C Mitomycin C Supplementary Fig S1. (A) ZR75- and MCF7-PELP1 knockdown cells were generated as described in methods section. Pooled colonies were analyzed for PELP1 expression by western blot analysis. (B) MCF7 cells were transiently transfected with PELP1-siRNA or control siRNA. After 48h, cells were exposed to indicated concentration of campothecin and cell viability was measured using MTT assay. (C) ZR75 cells transiently transfected with PELP1-siRNA or control siRNA. After 48h, cells were exposed to γ–radiation (2gy) and clonogenic (survival) assay was performed after 10 days. Survival fraction is expressed as percentage of colony formed in their respective untreated control group. p53 non functional model cells HEK293T cells (D), IOMM-LEE (E) expressing PELP1-specific shRNA or control shRNA were treated with indicated concentrations of Mitomycin C and clonogenic survival was assayed after 10 days. Error bar depicts standard error from triplicate experiments. *P<0.05, ** P<0.001.
A C Con-shRNA PELP1-shRNA Con-siRNA PELP1-siRNA - + - + - + - + CPT p-p53 Ac-p53 Tot -p53 Actin B D E Supplementary Fig. S2. (A) MCF7 cells stably expressing PELP1-shRNA vector (left panel) or transiently expressing PELP1 siRNA (right panel) were treated with gamma radiation. 6h later, cell lysates were prepared and subjected to Western analysis using indicated antibodies. (B) MCF7 cells expressing control or PELP1 siRNA were treated with CPT and levels of p53 RNA was measured by RTqPCR assay. (C,D) MCF7 cells stably expressing PELP1 shRNA or control shRNA vector were treated with either 50 µM etoposide for 12h (C) or Gamma Irradiation 5 Gy (D). RNA was isolated and the status of p53 target genes was analyzed by qRT-PCR analysis. (E) MCF7 cells with or without PELP1shRNA were treated with gamma irradiation (5 Gy) and allowed to recover for 24 h. Percentage of cells in S-phase cells were determined by FACS analysis. * P<0.05, **P<0.01, *** P<0.001,
p53 PELP1 DAPI Merge DAPI PELP1 Merge p53 DMSO DAPI PELP1 Merge pS15-p53 campothecin campothecin Supplementary Fig. S3. ZR75 breast cancer cells cultured on glass coverslips were treated with campothecin (1mM) for 2hr. Cells were then fixed and co-stained with antibodies against PELP1 (red) and p53 (green), pS15p53 (green), and analyzed by confocal microscopy. DAPI was used to localize the nucleus. Co-localization PELP1 and p53 can be seen by yellow color.
A C B Supplementary Fig. S4. (A) MCF7 cells were transfected with p53-reporter plasmid along with different doses of GFP-PELP1 plasmids and luciferase activity was recorded after 24 h. (B) ZR75 cells with stable PELP1 knockdown (ZR75-PELP1shRNA) were co-transfected with p53-reporter plasmid along with different doses of shRNA resistant GFP-PELP1 plasmids. Luciferase values or normalized with -gal activity and the data shown are the means of ± SEM performed in triplicate wells. (C) ZR75 cells were co-transfected with p53-reporter plasmid with the GFP vector or with increasing doses of GFP-PELP1 WT or MT plasmids. Luciferase activity was measured after 24h. Luciferase values were normalized to b-gal activity and the data shown are the means of ± SEM performed in triplicate wells. **, P<0.01.