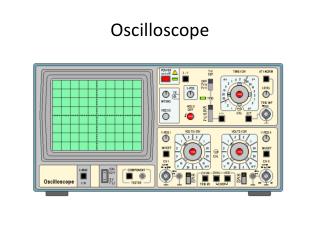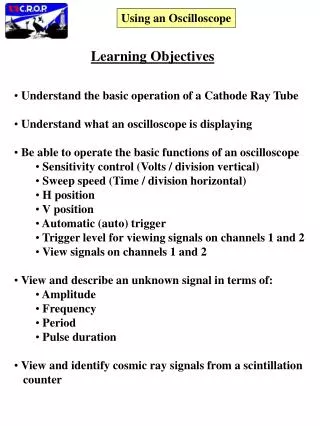
Oscilloscope
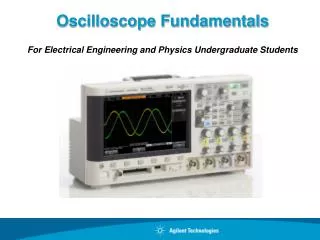
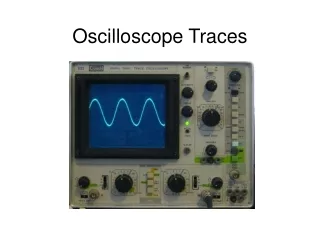
Oscilloscope. The oscilloscope is basically a graph-displaying device It draws a graph of an electrical signal. In most applications the graph shows how signals change over time: the vertical (Y) axis represents voltage the horizontal (X) axis represents time.

Oscilloscope
E N D
Presentation Transcript
The oscilloscope is basically a graph-displaying device • It draws a graph of an electrical signal. • In most applications the graph shows how signals change over time: • the vertical (Y) axis represents voltage • the horizontal (X) axis represents time.
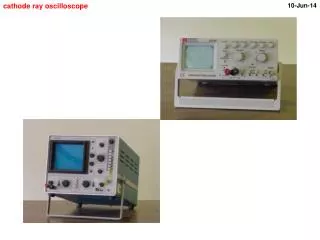
Horizontal sweeps at a constant rate. Vertical plates are attached to an external voltage, the signal you attach to the scope.
Cathode Ray Tubes Variation in potential difference (voltage) placed on plates causes electron beam to bend different amounts.
This simple graph can tell you many things about a signal: • You can determine the time and voltage values of a signal. • You can calculate the frequency of an oscillating signal. • You can see the "moving parts" of a circuit represented by the signal. • You can tell if a malfunctioning component is distorting the signal. • You can find out how much of a signal is direct current (DC) or alternating current (AC). • You can tell how much of the signal is noise and whether the noise is changing with time.
If a signal repeats, it has a frequency. The frequency is measured in Hertz (Hz) and equals the number of times the signal repeats itself in one second
Grounding • Proper grounding is an important step when setting up to take measurements. • Properly grounding the oscilloscope protects you from a hazardous shock and protects your circuits from damage. • Grounding the oscilloscope is necessary for safety. If a high voltage contacts the case of an ungrounded oscilloscope, any part of the case, including knobs that appear insulated, it can give you a shock. However, with a properly grounded oscilloscope, the current travels through the grounding path to earth ground rather than through you to earth ground.
To ground the oscilloscope means to connect it to an electrically neutral reference point (such as earth ground). Ground your oscilloscope by plugging its three-pronged power cord into an outlet grounded to earth ground. • Grounding is also necessary for taking accurate measurements with your oscilloscope. The oscilloscope needs to share the same ground as any circuits you are testing. • Some oscilloscopes do not require the separate connection to earth ground. These oscilloscopes have insulated cases and controls, which keeps any possible shock hazard away from the user.
Scope Probes Most passive probes have some degree of attenuation factor, such as 10X, 100X, and so on. By convention, attenuation factors, such as for the 10X attenuator probe, have the X after the factor. In contrast, magnification factors like X10 have the X first
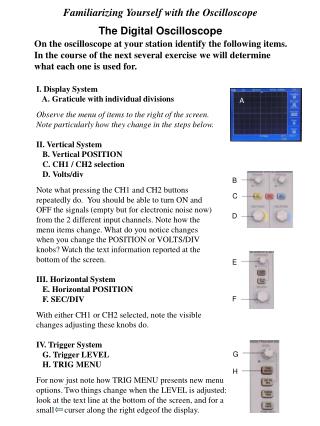
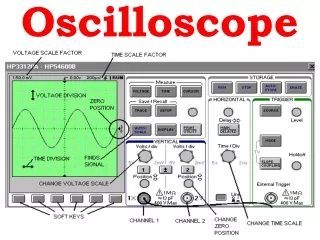
Vertical Controls • Position and Volts per Division • The vertical position control lets you move the waveform up or down to exactly where you want it on the screen. • The volts per division (usually written volts/div) setting varies the size of the waveform on the screen.A good general purpose oscilloscope can accurately display signal levels from about 4 millivolts to 40 volts. • Often the volts/div scale has either a variable gain or a fine gain control for scaling a displayed signal to a certain number of divisions.
Horizontal Controls • Position and Seconds per Division • The horizontal position control moves the waveform from left and right to exactly where you want it on the screen. • The seconds per division (usually written as sec/div) setting lets you select the rate at which the waveform is drawn across the screen (also known as the time base setting or sweep speed). This setting is a scale factor. For example, if the setting is 1 ms, each horizontal division represents 1 ms and the total screen width represents 10 ms (ten divisions). Changing the sec/div setting lets you look at longer or shorter time intervals of the input signal.