Observations on RAMAC Readback Waveforms at Computer History Museum
120 likes | 229 Vues
Explore the decoded RAMAC data waveforms and signal patterns observed at Computer History Museum in 2007. Decoding process, data contents, and waveform analysis provide valuable insights into historical data storage methods.

Observations on RAMAC Readback Waveforms at Computer History Museum
E N D
Presentation Transcript
RAMAC Oscilloscope Observations Joseph Feng Magnetic Disk Heritage Center Computer History Museum June 22, 2007
Acknowledgements • Thanks to Al Hoagland, Pat Connolly, and the students at Santa Clara University for bringing up the RAMAC • Thanks to the IBM Corporation for loaning the RAMAC drive • Thanks to Hitachi Global Storage Technologies, Steven Lambert, and Terry Whittier for providing computers and oscilloscopes • Thanks to the Computer History Museum for providing the laboratory facilities
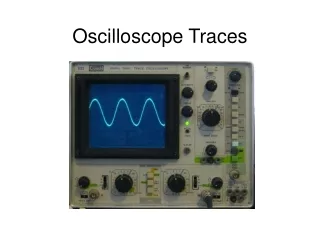
RAMAC readback waveform - “bottom” head at OD CE track (Tektronix) Top trace: expanded view showing details Bottom trace: one full record (20% of track) showing starting sync burst, start gap, 100 characters of data, and end gap OD track (-01)complex waveform
RAMAC readback waveform - “bottom” head at ID CE track (Tektronix) Same text data as on the OD waveform - vertical scale changed for top trace, same for bottom trace Note the wider pulse widths, lower signal amplitude, and poorer signal-to-noise ratio ID track (100) complex waveform
RAMAC readback waveform - “bottom” head at a customer data track (Tek) This is representative of the most commonly observed data pattern Repeating blocks of 10000001, which decodes into blank data (unpunched column in IBM card) Customer data track - blank data
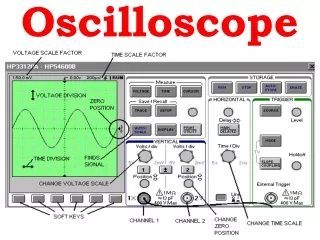
Decoding the RAMAC data1 • The RAMAC readback waveforms for two consecutive revolutions were captured with a LeCroy 9345AL digital oscilloscope • 10 ms per waveform, no averaging • 100ns/sample or about 100X oversampling • 1,000,000 samples per waveform • The apparently high noise levels in the waveforms is attributed to the increased bandwidths in the modern electronics and the oscilloscope • scope bandwidth ~500 MHz • a 733-based preamplifier had an estimated bandwidth of about 10MHz and a net gain of about 5X; its two key functions were to provide the proper load impedance for the heads and to act as a differential-to-single-ended adapter from the heads to the oscilloscope
Decoding the RAMAC data2 • A program was written to decode the digitized waveforms • After mathematically reducing the noise, 100% of the 10,054 sectors (out of 10,200 possible) were decoded without any obvious errors • one sector had real errors, apparently due to bad overwrite • two characters were decoded with proper parity, but “not allowed” • 28 “unformatted” tracks were observed, most had low-amplitude transitions, variable envelopes, maybe due to low write current • one track had been used for experiments by SCU students
Contents of the RAMAC data1 • Most of the CE tracks (-01 and +100) had test track identifying text • Most tracks had blank data or tables with references to Canadian companies, including one to “EXPO 67 CANADA” • Six sectors had “non-boring” readable text, with typographical errors • One reference on three sectors to the final results of the 1965 World Series, with October 14, 1965 date, the correct result, and a humorous (and obviously deliberate) misspelling of Sandy Koufax • The 40+-year old data appears to be well-preserved. There were no errors that could be attributed to data decay. In most cases, the tracks with low amplitude/bad envelopes were adjacent to good tracks with no signs of distress or readback errors
Head moved across one data track from OD (rim) to ID (hub) (LeCroy) Top trace: 100 ms or two revolutions, showing data envelope Lower trace: index pulses The spikes at the start of each record, seen on the ID side of the scan, is due to old data, with the new data written slightly OD and down-track compared to old data Waveform envelopes - 1well-aligned sectors
Head moved across one data track from OD (rim) to ID (hub) (LeCroy) Envelope modulation in 10ms blocks due to cross track offsets between sectors The modulation pattern on the ID (hub) side is the complement of the pattern seen on the OD (rim) side Decoded waveforms taken at the point of minimum amplitude variation Waveform envelopes - 2showing cross track misalignment
Head moved across one track data from OD (rim) to ID (hub) (LeCroy) The third sector after index shows a loss of amplitude compared to the other sectors Symmetric signal loss on both hub and rim sides means it was not due to cross track misalignment Waveform envelopes - 3showing a “bad” sector
Head moved across five consecutive tracks from OD (rim) to ID (hub) (LeCroy) This shows the signal envelopes for the tracks near the one in the previous slide The adjacent tracks do not show a similar loss of amplitude, so the signal reduction may not have been due to a scratch or other defect Waveform envelopes - 4showing localization of “bad” sector