Download
1 / 28
280 likes | 458 Vues
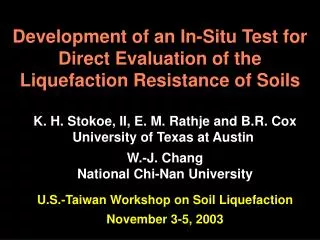
Development of an In-Situ Test for Direct Evaluation of the Liquefaction Resistance of Soils. K. H. Stokoe, II, E. M. Rathje and B.R. Cox University of Texas at Austin W.-J. Chang National Chi-Nan University U.S.-Taiwan Workshop on Soil Liquefaction November 3-5, 2003. Goal:

E N D
Development of an In-Situ Test for Direct Evaluation of the Liquefaction Resistance of Soils K. H. Stokoe, II, E. M. Rathje and B.R. Cox University of Texas at Austin W.-J. Chang National Chi-Nan University U.S.-Taiwan Workshop on Soil Liquefaction November 3-5, 2003
Goal: •develop an in-situ testing procedure that can be used to evaluate directly the cyclic liquefaction resistance of soilin terms of u vs. g for different numbers of cycles Key Characteristics: •involves a limited volume of material •shakes soil like an earthquake
Elements of the In-Situ Liquefaction Test • Dynamic loading source (similar to EQ shaking) • Embedded instrumentation array • (to monitor ground motion and measure pore pressure generation • and dissipation) • Analysis procedure(s) to permit shear strain time histories to be evaluated
Similar to Cyclic Strain Approach Used in Laboratory Testing (Dobry et al. 1982) Pore pressure generation curve gt
Liquefaction sensor Accelerometer Settlement plate Schematic Layout of Field Setup in First-Generation Testing Waterproof liner Vibroseis Backfill soil Footing 2 1 0.3 m 3.3 m 1.2 m 5 0.3 m 4 3 0.3 m 0.3 m 1.2 m
Dynamic Field Source Well-Controlled Dynamic Loading: • uniform cyclic amplitude (g) • specified frequency (f) • specified number of cycles (N) Dynamic Sources: • First Generation-Vertical Vibroseis • Second Generation – T-Rex • and Liquidator
First-Generation Source: Vibroseis -Involves Rayleigh Waves Z Direction
Second-Generation Source: T-Rex - Involves Shear Wave Loading in X, Y or Z Directions
Theoretical Performance of T-Rex: Vertical and Horizontal Modes 300 (60 kips) Vertical Mode 250 12 Hz 200 Force, kN 150 (30 kips) Horizontal Modes 5 Hz 100 50 0 0 20 40 60 80 100 120 Frequency, Hz
Second-Generation Source: Liquidator – Involves Shear Waves Loading in X or Z Directions
Comparison of the Vertical Force Outputs of T-Rex and Liquidator 150 1.3 Hz Liquidator 100 Force, kN (20 kips) 50 T-Rex-Vertical 0 0 1 2 3 4 5 Frequency, Hz
Embedded Instrumentation Array “Liquefaction Sensor” • measure soil particle motion • (2-D and 3-D geophones) • measure pore pressure generation • all measurements at same location Settlement Plates
First-Generation Liquefaction Sensor V. Geophone 8.9 cm Filter PPT H-Geophone Shoe 2.5 cm 3.8 cm
Instrumentation Van during Preliminary Field Trials • Sercel 408XL System, up to 2000 channels • VXI Technology System, 48-channel analyzer
Field Testing Procedure Seismic testing Settlement-plate elevations Apply dynamic loading for a specific number of cycles Staged testing Interactive testing Data analysis Rest for 30 minutes to 2 hours Final settlements Final S-wave velocities Retrieve sensors Saturation evaluation In-situ density measurement
Data Analysis • Pore pressure processing • PPT data processing • Hydrodynamic and Residual pore pressure • Shear strain • calculations 1. Processing of Geophone data 2. Strain calculation methods Pore Pressure Generation Curves
Liquefaction sensor Accelerometer Settlement plate Schematic Layout of Field Setup in First-Generation Testing Waterproof liner Vibroseis Backfill soil Footing 2 1 0.3 m 3.3 m 1.2 m 5 0.3 m 4 3 0.3 m 0.3 m 1.2 m
QUARRY TEST SITE IN AUSTIN, TEXAS First-Generation Vibroseis First-Generation Instrumentation Van
Test Series T1 – Small-Strain Level Test T1-3 at center of the array 10 20 2 Shear Strain (x10-3 %) 0 0 -2 0.0 0.2 0.4 0.6 0.8 1.0 1.2 1.4 Time (sec) 4 (Band-pass filtered) 10 2 Pore Pressure Ratio, ru (%) 0 0 -2 20 -4 0.0 0.2 0.4 0.6 0.8 1.0 1.2 1.4 1.6 Time (sec) sv = 6.4 kPa
Test Series T1 – Large-Strain Level Test T1-6 at center of the array 30 AW average Shear Strain (x10-3 ) 10 0 -10 SDM method -30 0.0 0.5 1.0 1.5 2.0 Recorded ru Residual ru 80 Pore Pressure Ratio, ru (%) 40 0 0.0 0.5 1.0 1.5 2.0 Time (sec)
Pore Pressure Generation Curves for Different Numbers of Loading Cycles 100 Note:gxz calculated by the SDM method 80 Dr = 35% Pore Pressure Ratio, ru (%) 60 n=20 cycles 40 gt n=10 cycles 20 n=5 cycles n=2 cycles 0 0.0001 0.001 0.01 0.1 1 Mean shear strain amplitude (%)
Installation of Embedded Sensors Hydraulic Ram Wire Ropeand Electrical Cable Hollow Push Rod Liquefaction Sensor Liquefiable Layer
Loading with Rayleigh (R) Waves Shallow Instrumented Zone Rayleigh Waves(Vertical Particle Motion)
Loading with Shear (SH) Waves Shallow Instrumented Zone Horizontally Polarized Shear (SH) Waves
Loading with Shear (SV) Waves ShallowInstrumented Zone Vertically Polarized Shear (SV) Waves
Loading with Shear Waves (SV) at Depth Instrumented Zone at Depth Vertically Polarized Shear (SV) Waves
Conclusions • Development of the basic elements of a field liquefaction test have been initiated with first-generation equipment. • Successful measurements of ground motion and pore pressure generation have been conducted. • Second-generation dynamic sources, liquefaction sensors, and data acquisition equipment are nearly developed. • The test will continue to evolve over the next few years, but there are already numerous applications.
Thank you • National Science Foundation • United States Geological Survey • George E. Brown, Jr. Network for Earthquake Engineering Simulation (NEES) • Many graduate students at the University of Texas