Field-Stuart-Haas PRD
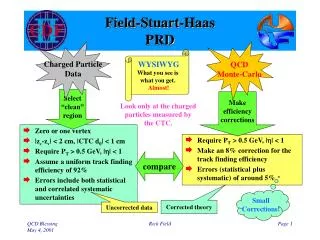
Field-Stuart-Haas PRD. Charged Particle Data. QCD Monte-Carlo. WYSIWYG What you see is what you get. Almost!. Zero or one vertex |z c -z v | < 2 cm, |CTC d 0 | < 1 cm Require P T > 0.5 GeV, | h | < 1 Assume a uniform track finding efficiency of 92%

Field-Stuart-Haas PRD
E N D
Presentation Transcript
Field-Stuart-HaasPRD Charged Particle Data QCD Monte-Carlo WYSIWYG What you see is what you get. Almost! • Zero or one vertex • |zc-zv| < 2 cm, |CTC d0| < 1 cm • Require PT > 0.5 GeV, |h| < 1 • Assume a uniform track finding efficiency of 92% • Errors include both statistical and correlated systematic uncertainties Select “clean” region Make efficiency corrections Look only at the charged particles measured by the CTC. • Require PT > 0.5 GeV, |h| < 1 • Make an 8% correction for the track finding efficiency • Errors (statistical plus systematic) of around 5% compare Small Corrections! Corrected theory Uncorrected data Rick Field
Charged Particle DfCorrelations • Look at charged particle correlations in the azimuthal angle Df relative to the leading charged particle jet. • Define |Df| < 60o as “Toward”, 60o < |Df| < 120o as “Transverse”, and |Df| > 120o as “Away”. • All three regions have the same size in h-f space, DhxDf = 2x120o = 4p/3. Rick Field
Charged Multiplicity versus PT(chgjet#1) • Data on the average number of “toward” (|Df|<60o), “transverse” (60<|Df|<120o), and “away” (|Df|>120o) charged particles (PT > 0.5 GeV, |h| < 1, including jet#1) as a function of the transverse momentum of the leading charged particle jet. Each point corresponds to the <Nchg> in a 1 GeV bin. The solid (open) points are the Min-Bias (JET20) data. The errors on the (uncorrected) data include both statistical and correlated systematic uncertainties. Underlying Event “plateau” Blessed on 11/3/99 Rick Field
“Transverse” Nchg versus PT(chgjet#1) • Plot shows the “Transverse” <Nchg> versus PT(chgjet#1) compared to the the QCD hard scattering predictions of Herwig 5.9, Isajet 7.32, and Pythia 6.115 (default parameters with PT(hard)>3 GeV/c). • Only charged particles with |h| < 1 and PT > 0.5 GeV are included and the QCD Monte-Carlo predictions have been corrected for efficiency. Isajet 7.32 Pythia 6.115 Herwig 5.9 Blessed on 11/3/99 Rick Field
“Transverse” Nchg versus PT(chgjet#1) • Plot shows the PT distribution of the “Transverse” <Nchg>.Each point corresponds to the d<Nchg>/dPT in a 1 GeV bin. • The triangle and circle (square) points are the Min-Bias (JET20) data. The errors on the (uncorrected) data include both statistical and correlated systematic uncertainties. To be blessed Rick Field
“Transverse” Nchg versus PT(chgjet#1) • Plot shows the data on the PT distribution of the “Transverse” <Nchg> for PT(chgjet#1) > 2 GeV/c compared with the QCD hard scattering prediction of HERWIG. • The dashed (solid) curves show the contribution arising from the beam-beam remnants (total). Theory Curves Rick Field
“Transverse” Nchg versus PT(chgjet#1) • Plot shows the data on the PT distribution of the “Transverse” <Nchg> for PT(chgjet#1) > 30 GeV/c compared with the QCD hard scattering prediction of HERWIG. • The dashed (solid) curves show the contribution arising from the beam-beam remnants (total). Theory Curves Rick Field
“Transverse” Nchg versus PT(chgjet#1) • Plot shows the data on the PT distribution of the “Transverse” <Nchg> for PT(chgjet#1) > 30 GeV/c compared with the QCD hard scattering prediction of HERWIG, ISAJET, and PYTHIA 6.115. Theory Curves Rick Field