Model calibration using
Model calibration using. Major steps of hydrologic modeling. (Hydrologic) data Relate to model inputs. Parameter estimation or model calibration. Model -- parameters. Predictions. Prediction uncertainty. Societal decisions. What is Model Calibration?.

Model calibration using
E N D
Presentation Transcript
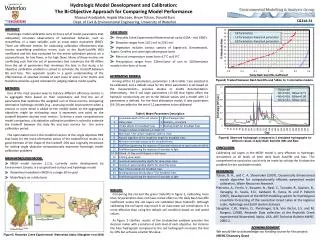
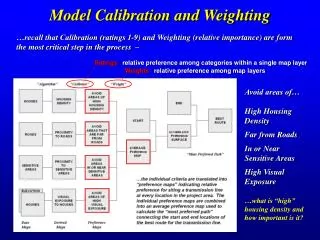
Major steps of hydrologic modeling (Hydrologic) data Relate to model inputs Parameter estimation or model calibration Model -- parameters Predictions Prediction uncertainty Societal decisions
What is Model Calibration? Adjustment of the parameters of a mathematical or numerical model in order to optimize the agreement between observed data and the model's predictions. American meteorological society The process of adjusting model inputs so that model calculations match what we measure in the real-world. So, a good model calibration is not sufficient to develop a good model. Also need good data, a good model, and an adequate optimization method. PEST program
Real world data PEST program
Attempt 1 for model calibration PEST program
Attempt 2 for model calibration PEST program
Attempt 3 for model calibration PEST program
Calculation of residuals for model calibration PEST program
Statistical measures involving residuals PEST program
PEST is a nonlinear parameter estimation package capable of estimating parameters for any computer model. It solves a nonlinear least squares problem and minimizes the differences between the model's outputs and field measurements such as the calculated and measured discharges. PEST adapts to the model, the model does not need to adapt to PEST. PEST program
Minmizing Sum of Squared Residuals (SSR) The use of this equation, as an objective function to be minimized, implies certain assumptions about the residuals (Clarke, 1973): • That the time series of residuals have zero mean and constant variance • That the time series of residuals does not have a significant autocorrelation If confidence intervals are to be given for the estimated model parameters, then: c) residuals have to be distributed normally. PEST program
The role of PEST • (initial) Parameter Sensitivity Analysis : conducted on a larger parameter space, which allows excluding from the further analysis those parameters that have a relatively small impact on the model response. • 2. Calibration: (parameter estimation): PEST “calibrates” a model by reducing the discrepancies between model outputs and field observations to a minimum in the weighted least squares sense. • 3. Predictive analysis: Once a parameter set has been determined for which model behavior matches system behavior as well as possible, it is then reasonable to ask whether another parameter set exists which also results in reasonable simulation by the model of the system under study. PEST program
PEST template, instruction, and control files • Template file: tells PEST how to write parameters in the model input file • 2. Instruction file: tells PEST where it has to look for the model-generated output, and how to read it e.g. which column contains the simulated discharges. • 3. PEST conrol file: contains:User-supplied initial parameter values, range of permissible values that a parameter can take, observations, maximum number of iterations, etc. PEST program
Optimization algorithm can be classified into two categories: • Global search e.g. Shuffled Complex Evolution-University of Arizona (SCE-UA, 1992). • searches the entire parameter space and do a controlled random search in the direction of global optimum. • 2. Local search e.g. PEST program (Doherty, 1994). Estimate parameters with observations using a gradient-based method. • Gradient methods are much faster but can get stuck in local minima. PEST program
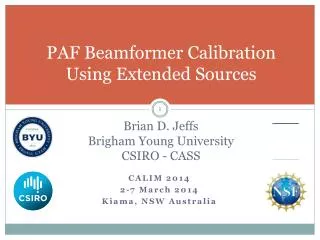
Local and global minima It shows that for any given goal function, there exits many parameter sets for which the goal functions are not significantly different from each other, i.e., there are many potential solutions based on quite different parameter sets. Response surface for an inverted goal function. Local minima are represented as peaks. PEST program
Based on Objective Function, the automated calibration procedures can be classified as: • Single objective procedures e.g. mean squared errors in PEST program. • PEST trys to minimize the objective function in order to obtain a better fit between predicted and observed values. PEST offers the best parameter set. • 2. Multiple objective procedures. • The generated output from this approach is a set of solutions (called pareto solutions) instead of a unique solution. PEST program
When is a Model Calibrated? As the problem of parameter optimization is not unique, it is important that we define when a model is calibrated and what the magnitude of the prediction uncertainty is. PEST program
To see when a model is calibrated: • Calculate the 95% prediction uncertainty PEST program
2. Normally, more than 80 percent of obsevations should be braketet by 95% confidence intervals (the upper and lower limits of the best parameter sets) a) is not a parameter calibration problem, b)calibration can obtain smaller uncertainty distribution, c) it can be expected that some measured data can fall outside the 95PPU. PEST program
3. Upon reaching the above criteria, if there exits a significant r2 and/or Nash-Sutcliff coefficient between the best simulation and the measured data for a calibration and a test (validation) data set, then the model can be considered calibrated. PEST program
Calibration issues • After analysing residuals to check whether they are independent, homoscedastic and normally distributed with zero expectation; • We need to consider following questions: • What is the data quality and error (data uncertainty)? How does it affect predictions? • What is the sensitivity of model matches to changes in model inputs? (non-uniqueness in solutions) • How good is good enough, for a well calibrated model? PEST program
Thank you PEST program
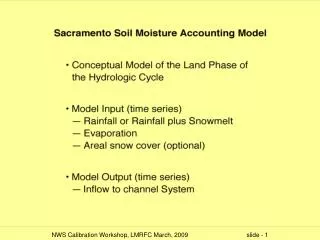
WetSpa model parameter sensitivity for the Illinois River basin PEST program
Streamflow simulation using WetSpa at Illinois River basin, Oklahoma, USA PEST program
PEST input template for WetSpa PEST program
PEST Instruction file for WetSpa PEST program
PEST conrol file for WetSpa PEST program