Download
1 / 8
140 likes | 672 Vues
Population Pyramids /Age-Sex Pyramid. An age-sex graph , is commonly referred to as a population pyramid even though the graph for some countries is not actually a pyramid shape Displays: a population's age and sex composition. Why we use Pop Pyramids.

E N D
Population Pyramids /Age-Sex Pyramid • An age-sex graph, is commonly referred to as a population pyramid • even though the graph for some countries is not actually a pyramid shape Displays: a population's age and sex composition
Why we use Pop Pyramids • Population pyramids reveal a great deal about a population at a glance. • Populations of countries can differ markedly as a result of past and current patterns of fertility, mortality, and migration
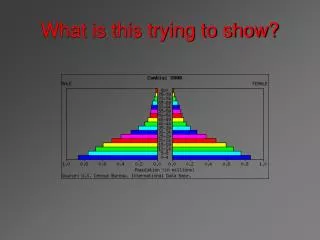
Pyramid Components • Horizontal bars represent the numbers or proportions of males and females in each age group, or cohort. • The sum of all the age-sex cohorts in the population pyramid equals 100 percent of the population. • Cohorts may vary from single years to groups of years.
Pyramid Components, cont. • The left side of the pyramid represents the male population and the right side, the female population. • The bars at the bottom of the pyramid represent the percent of the population. Sometimes this is represented as a total number, however. EX: male 0-4 years old (left) and the percent of the population that is female, 0-4 years old (right). • Each bar above the base represents the next five-year cohort, male and female, in the population.
Pyramid Characteristics • As cohorts age, they inevitably lose members because of death and they may gain or lose members because of migration. • After age 45 the loss of population accelerates, causing the narrowing peak of all population pyramids.
3 General Profiles • 1. Rapid growth is indicated by a pyramid with a large percentage of people in the younger ages. • 2. Slow growth is reflected by a pyramid with a smaller proportion of the population in the younger ages. • 3. Zero growth or decreasing populations are shown by roughly equal numbers of people in all age ranges, tapering off gradually at the older ages