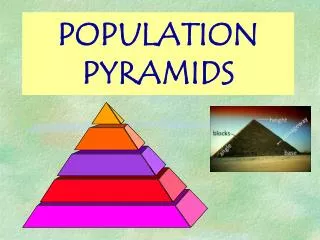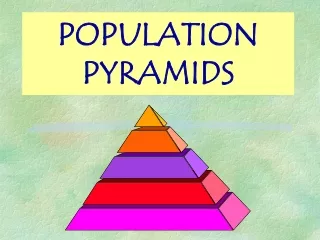
Understanding Population Pyramids
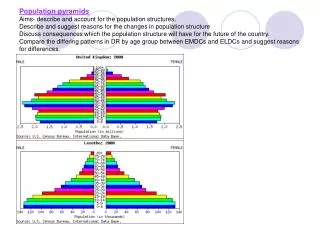
Understanding Population Pyramids. What does it mean that Mexico’s population pyramid is very wide at the bottom?. What does it mean that Sweden’s population pyramid is wider at the top than Mexico’s?. What predictions can you make from these population pyramids?. Population Pyramids.

Understanding Population Pyramids
E N D
Presentation Transcript
What does it mean that Mexico’s population pyramid is very wide at the bottom?
What does it mean that Sweden’s population pyramid is wider at the top than Mexico’s?
What predictions can you make from these population pyramids?
4 3 5 2 1
1. Decline in Birth Rate 2. Baby Boom 3. Fewer men due to World War I and II 4. More women due to: a. longer life expectancy and b. World Wars (I and II) 5. More 75-79 yrs than 0-4 yrs. Signs of a future worker shortage and an overall declining population. Analysis of Italy’s Population Pyramid
Aging population… …declining birth rate
Population Pyramids at Different Scales Country State County (Borough)
http://dsc.discovery.com/fansites/deadliestcatch/deadliestcatch.htmlhttp://dsc.discovery.com/fansites/deadliestcatch/deadliestcatch.html
ACTIVITYforSelected Population Pyramids in the United States
Choices… A. Ann Arbor, MI B. Buffalo county, SD C. Fort Bragg, NC D. Leavenworth, KS E. Manhattan, NYC F. Nothhamton, MA G. Punta Gorda, FL H. Springfield, IL
Helpful Hints… A. Ann Arbor, MI - University of Michigan B. Buffalo county, SD - Crow Creek Indian Reservation, one of the poorest counties in the United States C. Fort Bragg, NC - United States Army Fort D. Leavenworth, KS - United States Penitentiary E. Manhattan, NYC - wealthy downtown, few large families F. Nothhamton, MA - Smith College, an all girls college G. Punta Gorda, FL - retirement community H. Springfield, IL - average American city
1. B 2. A 3. E 4. C 5. G 6. H 7. F 8. D Answers
B A E C G H F D
Guest Workers from India in the Persian Gulf Countries http://fusions.wordpress.com/2007/08/06/migrant-workers-in-dubai
http://kotaku.com/gaming/only-in-japan/strange-japanese-game-center-name-226261.phphttp://kotaku.com/gaming/only-in-japan/strange-japanese-game-center-name-226261.php http://www.economist.com/world/displaystory.cfm?story_id=9539825
Slow Decline http://www.airninja.com/worldfacts/countries/Argentina/fertilityrate.htm
Persistent Poverty and Violence http://www.islamic-relief.com/submenu/appeal/somalia_crisis.htm http://www.biyokulule.com/February_%201990s(4).htm
Constructing and Analyzing Population Pyramids Finding Age Sex Statistics on the U.S. Census Web Site Population Pyramid Construction directions using Microsoft Excel
With the population pyramids displayed on the wall discuss the differences between the population pyramids in different areas of the county. Why are there differences? Where in the county is it wealthy? Poor? Where in the county is the population the youngest? Oldest? How do the suburbs differ from the inner city? Analysis and Evaluation for the Metropolitan Area