Download
1 / 12
120 likes | 316 Vues
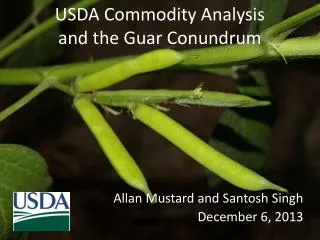
USDA Commodity Analysis and the Guar Conundrum. Allan Mustard and Santosh Singh December 6, 2013. Why Does Everyone Look to USDA?. Reliable , credible, objective and unbiased Publications and data on-line and updated regularly FREE !. USDA has the most resources:.

E N D
USDA Commodity Analysisand the Guar Conundrum Allan Mustard and Santosh Singh December 6, 2013
Why Does Everyone Look to USDA? • Reliable, credible, objective and unbiased • Publications and data on-line and updated regularly • FREE!
USDA has the most resources: • Global Intelligence Network • Trained Technical Personnel • Sophisticated Technology • Extensive Databases • Timely Global Communication
Country/Commodity Balance Sheets SUPPLY = DEMAND Ending Stocks Domestic Use Beginning Stocks Production Imports Exports + + = + + Private Area Commercial Feed / Residual (On-farm) Yield Concessional FSI (Pipeline) (Food) Government (Seed) (Security) (Industrial) (Public Distribution)
InputFrom Multiple Sources Agribusiness World Weather Reports TravelReports Wire Services OfficialCountry Reports Government Reports AttachéReports Private Market Reports Private Commodity Reports International Organizations
Output Used Worldwide TradeAssociations Consultants The Media State Agencies FarmingCorporations Industry Cooperators Finance andBrokers Secretary ofAgriculture Farmers Congress U.S. and Foreign Agricultural Attachés Agribusiness USDAAgencies Academia Other Governments
India: Wheat Yields, in metric tons per hectare, 1997/98 – 2009/10 stderr = 0.10
India: Guar Yields, in metric tons per hectare, 1997/98 – 2009/10 R² = 0.1052 stderr = 0.1318
High Yield Variation = High Unpredictability • Unusually wide yield variance • Large number of critical points • Relatively unresponsive to inputs
agnewdelhi@fas.usda.gov http://www.fas.usda.gov http://gain.fas.usda.gov http://www.fas.usda.gov/psdonline