Why Energy Matters
280 likes | 306 Vues
Explore the energy problem and the uncertainty surrounding peak oil, including conflicting reserve estimates and divergent opinions on future production rates. Understand the implications of rising oil demand and the challenges it poses to agriculture and sustainability.

Why Energy Matters
E N D
Presentation Transcript
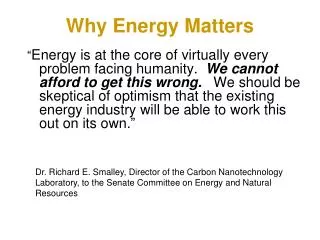
Why Energy Matters “Energy is at the core of virtually every problem facing humanity. We cannot afford to get this wrong. We should be skeptical of optimism that the existing energy industry will be able to work this out on its own.” Dr. Richard E. Smalley, Director of the Carbon Nanotechnology Laboratory, to the Senate Committee on Energy and Natural Resources
Is There an Energy Problem Why is it so hard to communicate the Peak Oil message? • The Boy Who Cried Wolf … “we’ve heard that before” • “They’re always finding more oil!” (true, but …) • Reserves/production = “40 years, at present rate of use” Acknowledging Peak Oil is only the first step toward understanding the problem: • “Market forces will ensure adequate energy for everyone – when prices go up, people will find alternatives!” (free-market theory) • “But we’ve got 40 years for science and technology to come through with something!”
Energy Future According to ASPO Energy Future According to USGS Huge Disagreement! How can something this important have so much uncertainty? (+/-100%!) 120 100 URR According to USGS, IEA, … URR = 3 Trillion Bbl 2+ Trillion Remaining 80 World URR According to ASPO 60 URR = ~2 Trillion Bbl 1+ Trillion Remaining 40 OPEC 20 ROW-Russia USA 0 1920 1940 1960 1980 2000 2020 2040
1) No Agreement on Crude Oil URR • Unreliable, missing, or unbelievable reserve numbers • Variable estimates for “reserve growth” applied at global level • How much “Yet to Be Discovered” exists? • Disagreement on impact of new technology • Uncertainty re. relation of price to exploration, discovery, and extraction rates • Wildly-varying estimates for future production rates and URR for tar sands, Venezuela heavy, shale oil
2) More Reasons for Confusion and Complacency For every Fossil-Fuel alarmist, there is another expert saying “No problem” Opinions run the gamut: • Utopian scenarios of fusion-enabled hydrogen-fueled industry, transport, and agriculture • Magical reversion to 18th-century way of life • Cataclysmic scenarios of war, starvation, death Without science or numbers behind them, all opinions are equally valid
Oil Demand Exceeding Expectations Population – world population projected to continue rising past 2050 or later (9-10 B) Industrial development – China’s oil imports rose 30+% in 2003, surpassing Japan; India and rest of SE Asia also exploding demand Middle-class aspirations in China, India Although losing industry, N American demand continues to rise – transport, electricity, gas Rest of world coming out of recession – EIA repeatedly raising estimates of demand
Agriculture was once very labor-intensive in human and animal power; what will substitute for fossil fuels now that we number 6.4 billion (heading for 9 to 10 billion) ? Agriculture US horse population peaked in 1915 at 25 million; 20% of all arable US land was used to feed horses. US humans numbered 100 million. In 2015, expect 300M people. There is no model for feeding 9 billion people without fossil fuel!
100 80 World World World World World 60 OPEC OPEC OPEC OPEC OPEC 40 20 ROW-Russia ROW-Russia ROW-Russia ROW-Russia ROW-Russia USA USA USA USA USA 0 2300 2200 2200 1880 2100 2100 2100 2060 2060 2080 1900 1900 1900 1920 1940 1800 1960 1800 1980 1980 1980 2000 2000 2000 2000 2000 2000 2000 2020 2040 1700 2040 2040 2040 1920 1920 1920 1960 1960 1960 2020 2020 1940 1940 The Big Picture – Oil Production over History M bbl/day ?
Understanding Net Energy • All energy sources require up-front investment in energy, as well as $ capital and human effort, to yield a return on that investment • NET ENERGY: Energy Returned on Energy Invested = ERoEI • Some investments are better than others • Some investments are energy losers! • How can we know which ones to invest in?
You are here History and Future of Oil Supply Oil & NGL’s, from ASPO
Supply-Demand Mismatch • No near-term substitute for oil • The Hubbert Peak
History of the Hubbert Peak • In 1956, Shell geologist Dr Marion King Hubbert predicted that US domestic oil production would peak in the early 1970s and then begin an irreversible decline. • Hubbert's prediction was the subject of water-cooler confabs in every oil company office in the US and - because US production was growing exponentially at the time - it was laughed off. • Hubbert was fired. • 15 years later (1971), US oil production peaked and began an irreversible decline. The phenomenon is now called “Hubbert's Peak”
The 1973 “Arab Oil Embargo” tripled the price of oil. • Since the US couldn’t supply its own oil demand anymore, the US intensified its search for oil, and there was serious effort at conservation (smaller cars, 55mph limit, CAFE). • In 1979 there was a real “Oil Shock” (the Iranian Revolution) and another in 1980 (the Iran-Iraq War). As new oil fields discovered in the 1970s came online, prices fell to $10/barrel by 1998. Concerns about limited supply were dead. By 2004, 50% of vehicles sold were “light” trucks and SUVs. But U.S. production never regained 1971 levels.
The global rate of oil production must peak out and then start to decline.