Download
1 / 18
180 likes | 274 Vues
C O L U M N G R A P h. We all have the same width. Same width. By Zani Alam. What is a survey?. A way of collecting information. Surveys are a primary source of information –provide link to the vocab page. Survey. Uses questions.

E N D
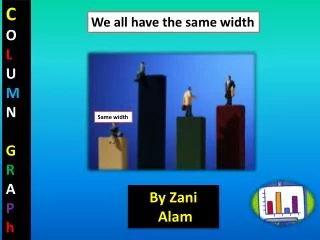
C O L U M N G R A P h We all have the same width Same width By Zani Alam
What is a survey? A way of collecting information Surveys are a primary source of information –provide link to the vocab page. Survey Uses questions Helps to find the views of the whole community or group
Use of surveys Real world application Surveys can be used to find out attitudes of people about various issues Survey To measure client satisfaction
When should you conduct a survey? • The information you need isn't readily available through other means.
Column graph Column graphs have a series of vertical blocks. Column graphs can be distinguished from histograms because the blocks always have gaps between them while histograms have no gaps. Use of column graphs A column graph is used to show relationships between groups. The two items being compared do not need to affect each other. It is a fast way to show big differences. Column graphs are an excellent way to show results that are one time, that aren't continuous - especially samplings such as surveys.
How do to construct a column graph • Column graphs are drawn with parallel columns placed vertically. The width of each bar and the spacing between the bars are kept the same to avoid giving a misleading representation. • The columns or bars can be used to show what is happening with one thing or they can be divided into sections to represent several parts. The column can be drawn spaced evenly or apart or together in groups. • 1- Always place numbers on the vertical axis. Non-numerical groups are on the horizontal axis. • 2- Draw two axes: one vertical and one horizontal. Make sure you leave room at the edge of the page for your labels. • 3- Columns should be of the same width and should not touch at all. • 4- Arrange categories from smallest to largest if appropriate. • 5- Label each axis. • 6- The scale should go up evenly and cover the largest and smallest values. • 7- Include scientific units where appropriate. • 8- Include a title to explain what the graph is about. Your title should start with: Graph of……..
Summary A column graph has two lines or axes. One is the horizontal axis which goes from side to side. A column graph is used to show relationships between groups. Column graph The other is the vertical axis which goes up and down. Column graphs are an excellent way to show results that aren't continuous - especially samplings such as surveys.
Things you should follow when drawing a column graph use graph paper Leave 0.5 cm gap at the start Column graphs have a series of vertical blocks. Always place numbers on the line vertical axis. • Columns should be of the same width and should not touch at all. use a pencil • Non-numerical groups are on the horizontal axis. Draw in the two axes with a ruler
Example PDHP (tables and graphs) This table shows the favourite sport played by year 7B. Draw a suitable graph for your data.
Graph of the types of sport played by 8B Title Step 1: Draw the axes Step 2: Always place numbers on the vertical axis. Non-numerical group on the horizontal axis. Step 3: Label them Step 4: Setting up the scales. Count how may squares represent 1 on vertical axis. Number of students On the horizontal axis, Leave 0.5 for the start . columns should be of the same width (1cm).. 1 cm Step 5: Putting up the values and drawing the columns Volleyball 0 Netball Basketball Soccer Step 6: Add a title Types of sport
Activity Create a Graph
Activities 1- Create a graph online (Do it tomorrow again) 2- Station activities 3- Design a game Check with P Create a Graph
Vocab page Primary source of information: that is, you directly ask someone for a response to a question, rather than using any secondary sources like written records. Survey: A way of collecting information Column graph Conduct: