Download
1 / 37
370 likes | 511 Vues
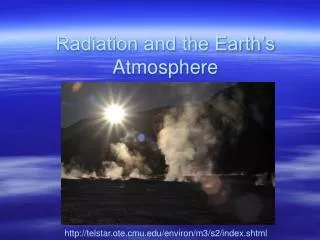
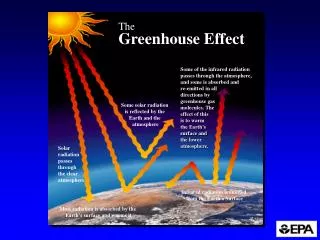
The Greenhouse Effect. Some of the infrared radiation passes through the atmosphere, and some is absorbed and re-emitted in all directions by greenhouse gas molecules. The effect of this is to warm the Earth’s surface and the lower atmosphere. Some solar radiation

E N D
The Greenhouse Effect Some of the infrared radiation passes through the atmosphere, and some is absorbed and re-emitted in all directions by greenhouse gas molecules. The effect of this is to warm the Earth’s surface and the lower atmosphere. Some solar radiation is reflected by the Earth and the atmosphere Solar radiation passes through the clear atmosphere Infrared radiation is emitted from the Earth’s Surface Most radiation is absorbed by the Earth’s surface and warms it
Carbon Dioxide ConcentrationsMauna Loa Parts per million 1958 1963 1968 1973 1978 1983 1988 1993 1998 Source: Keeling and Whorf, 1999
Examples of Greenhouse Gases Affected by Human Activities CO2 CH4 N2O Pre-industrial concentration 288 ppmv 848 ppbv 285 ppbv Concentration in 1999 366 ppmv 1800 ppbv 312 ppbv 100 year Global Warming Potential 1 21 310 Atmospheric lifetime (years) 50-200a 12b 120 ppmv = part per million volume; ppbv = part per billion volume a No single lifetime for CO2 can be defined because of the different rates of uptake by different processes. b Defined as an adjustment time which takes into account the indirect effects of methane on its own lifetime. Sources: IPCC 1995, CDIAC (Manua Loa, Siple Station, Law Dome “DE08”, AGAGE, and Law Dome “BHD” data)
750 700 600 500 400 Current Level 300 4 250 2 Temperature Change (oC) 0 200 Current Level -2 -4 -8 150 100 50 0 Temperature Change and CO2 Concentrations Thousands of years ago CO2 concentration in the atmosphere (Antarctic Ice Core) Temperature changes compared to the present temperature
Global Mean Land and Sea Surface Temperature: 1880-1999 Temperature Change (oC) Temperatures expressed relative to 1880-1997 average. Data Source:http://www.ncdc.noaa.gov/ol/climate/research/1998/anomalies/anomalies.html
Temperature Trends: 1901 to 1998 Red circles reflect warming; Blue circles reflect cooling All Stations/Trends displayed regardless of statistical significance. Source: National Climatic Data Center/NESDIS/NOAA
Precipitation Trends: 1901 to 1998 Green circles reflect increasing precipitation; Brown circles reflect decreasing precipitation All Stations/Trends displayed regardless of statistical significance. Source: National Climatic Data Center/NESDIS/NOAA
19oC Global average temperature 5 year average temperature IPCC high estimate IPCC best estimate IPCC low estimate 18oC 17oC 16oC 15oC 14oC 1900 1950 2000 2050 2100 Year Projected Temperature
Surface Air Warming: GFDL Model Results for 2xCO2 -5 0 5 10 15 20 25 Degrees (oF) Source: Manabe and Stouffer, 1994
Surface Air Warming: GFDL Model Results for 4xCO2 -5 0 5 10 15 20 25 Degrees (oF) Source: Manabe and Stouffer, 1994
0 10 20 30 40 50 60 Percent Reduction in Summer Soil Moisture: GFDL Model Results for 2xCO2 and 4xCO2 2xCO2 4xCO2 Percent Source: Manabe and Stouffer, 1994
0 1 2 3 4 5 Thickness (meters) Changes in March Sea Ice Thickness Control 4xCO2 Source: Manabe and Stouffer, 1994
Potential Climate Change Impacts Health Impacts Weather-related Mortality Infectious Diseases Air Quality-Respiratory Illnesses Agriculture Impacts Crop yields Irrigation demands Climate Changes Forest Impacts Change in forest composition Shift geographic rangeof forests Forest Health and Productivity Temperature Precipitation Water Resource Impacts Changes in water supply Water quality Increased competion for water Sea Level Rise Impacts on Coastal Areas Erosion of beaches Inundate coastal lands Costs to defend coastal communities Species and Natural Areas Shift in ecological zones Loss of habitat and species
Ways Climate Change Can Affect Human Health Mediating Process Health Outcomes DIRECT Thermal extremes (e.g., heatwaves) Changes in heat- and cold-related illnesses and deaths Deaths, injuries, psychological disorders; damage to public health infrastructure Other extreme weather events (floods, storms, etc.) CLIMATE CHANGE: TEMPERATURE, PRECIPITATION, AND WEATHER INDIRECT DISTURBANCES OF ECOLOGICAL SYSTEMS Geographic ranges and incidence of vector-borne diseases Geographic range and activity of vectors and infective parasites Altered local ecology of water-borne and food-borne infective agents Altered food productivity, and associated pests and diseases Changed incidence of diarrheal and certain other infectious diseases Regional malnutrition and hunger, impaired child growth and development Injuries, risks of infectious disease (due to migration, crowding, contaminated drinking water), psychological disorders Sea level rise, population displace- ment, and damage to infrastructure Levels air pollution, including pollens and spores Asthma and allergic disorders; acute and chronic respiratory disorders and deaths Source: Adapted from IPCC, 1995.
10 9 8 7 6 Standardized Mortality Rate per 100,000 5 4 3 2 1 0 0 10 20 30 40 50 60 70 80 90 100 110 120 130 Days from May to August Deaths Associated with the July 1966 Heat Wave, New York City Source: WHO, 1996
Current UKMO GFDL Probability that 4 Days in June Exceed City’s Temperature Threshold 100 80 60 40 20 0 Dallas Detroit Atlanta Chicago St. Louis Memphis New York Cincinnati Los Angeles Kansas City Minneapolis Philadelphia San Francisco Source: Probabilities of Temperature Extremes in the U.S.A, Version 1, NCDC, 1999; Kalkstein, 1989
1993 2020 2050 Average Annual Excess Weather-Related Mortality for 1993, 2020 and 2050 Climate 1500 1250 750 1000 600 750 450 500 300 250 150 300 0 0 250 New York City Chicago 60 200 50 200 150 40 300 100 160 30 250 50 120 20 200 0 10 80 Los Angeles 150 0 40 100 Phoenix 0 50 Atlanta 0 Dallas Sources: Kalkstein and Green (1997); Chestnut et al.(1995) Note: Includes both summer and winter mortality. Assumes full acclimation to changed climate. Includes population growth. GFDL Climate Change Scenario
- Likely - Very Likely - Highly Likely Human Health: Potential Spread of Vector-Borne Diseases Population Likelihood of at risk Present altered distribution Disease Vector (millions) Distribution with warming Malaria mosquito 2400 (sub)tropics Schistosomiasis water snail 600 (sub)tropics Filariasis mosquito 1094 (sub)tropics Onchocerciasis black fly 123 Africa/Latin (river blindness) America African trypano- tsetse fly 55 tropical Africa somiasis (sleeping sickness) Dengue mosquito 2500 (sub)tropics Yellow fever mosquito 450 tropical South America & Africa Source: WHO (1996)
Adaptation and Other Health Concerns • Measures to minimize health impacts include: • improved monitoring, surveillance, and control programs • disaster preparedness and response capability • wider use of protective technologies (sea walls and levees, water purification, vaccination) • public education • early warning systems, improved use of climate forecasts • Technical solutions may themselves pose health risks • e.g., pesticides to control for insect vectors • Potential reductions in biodiversity may result in losses of substances that can curedisease or relieve pain
Concentrations Health Responses Emissions • Secondary Pollutants • Affected by Weather • Conditions • Temperature • Precipitation • Windspeed and • Direction Combined Exposure to Stressful Weather and Air Pollution • Anthropogenic • Biogenic Interactions Between Climate Change and Air Quality
Meteorological Conditions Present on Ozone Exceedance Days (Chicago, 1977-1980) Parameter Threshold Value Maximum Daily Temperature >= 80oF Average Daily Wind Speed < 10.5 mph Precipitation None between 7am and 3pm Solar Radiation >410 langleys/day Notes: Present on 81% of ozone exceedance days in the Chicago area. Remaining exceedance days met 3 of 4 criteria. Source: Kolaz and Swinford, 1990
Known Adverse Effects of Air Pollutants Health Effects Acute Respiratory Illnesses and Asthma Aggravation PM, O3, NO2, SO2 Respiratory Hospital Admissions PM, O3 Cardio-Pulmonary Effects (e.g., stroke) CO, Pb Development of Chronic Respiratory Disease PM, O3 Cancer Air Toxics Premature Mortality PM, O3, SO2, Pb Reproductive Effects Air Toxics Direct Economic Effects Lost Work Days PM, O3 Decreased Worker Productivity O3 Material Damage & Soiling PM, O3, SO2 Crop Yield Loss O3 Commercial Fishery Harvest Loss Nitrogen Deposition Forestry Yield Loss O3 Ecological Effects Acidic Depostion SO2, NO2 Eutrophication Nitrogen Deposition Wetland Preservation Nitrogen Deposition, SO2
Regional 50% Probability Estimates of Sea Level Rise in 2100 and 2200 Portland, ME 19 43 Seattle, WA 19 42 New York, NY 22 48 San Fransisco, CA 15 36 Los Angeles 13 32 Charleston, SC 25 53 Miami Beach, FL 20 44 Grand Isle, LA 55 112 Estimates are in inches. Source: U.S. EPA (1995).
Drylands Wetlands West S & W Florida South Atlantic Northeast Louisiana Rest of Gulf Coast Mid-Atlantic U.S. Coastal Lands at Risk from a 20-inch Sea Level Rise in 2100 4000 3000 2000 Square Miles 1000 0 -1000 Source: U.S. EPA (1989).
1 0 1 2 3 Kilometers N Blackwater National Wildlife Refuge (Maryland) 1938 1980 Trapping Unit Marsh Open Water Upland
Baton Rouge Lafayette New Orleans Lake Charles Morgan City Houma Gulf of Mexico Land Lost Louisiana: Shoreline Change after a 20-Inch Rise in Sea Level Source: U.S. EPA, 1989.
Water Resources: Regional Vulnerability Arid Western River Basins Pacific Northwest Great Plains Great Lakes South- east North- east Use California Mississippi F F F F F Irrigation Thermal power F F F F F Industrial Municipal/ domestic F F F F F F F F F F Water quality F F F Navigation F F F F F Flood control F F F F Hydropower F F Recreation Source: U.S. EPA (1989)
Changes in Agricultural Yields2.5oF Warming; 7% Increase in Precipitation; 530 ppmv CO2 Change in Wheat Yield Change in Corn Yield Percent Change Source: Rosenzweig, 1995 -30 -20 -10 0 +10 +20 +30 >+30
Agricultural Resources: Potential Change inGrain Yield due to Doubled CO2 -30% -10% 10% 30% Percent of Change in Yield Based on GISS model; physiological CO2 effects included Source: Rosenzweig and Hillel (1993)
400 300 200 100 0 -100 Agricultural Resources: Increase in Global Population at Risk from Hunger GISS GFDL Millions UKMO Without Adaptation With Adaptation Change in Number of People at Risk of Hunger Source: Strzepak and Smith (1995)
Change in Potential Vegetation for 2050 Climate Scenario OSU Climate Current Climate Conifer Forest Broadleaf Forest Savanna/Woodland Shrub/Woodland Grassland UKMO Climate Source: Neilson, 1995 Arid Lands
Present Range Overlap Predicted Range Current and Projected Ranges of Sugar Maple Prediction based on increased temperature Prediction based on increased temperature and moisture reduction Source: Redrawn from Davis and Zabinski, 1992
Loss of Habitat for Brown Trout from a Doubling of CO2 - 2050 Not included in analysis * 1-49% Loss 50-100% Loss * Dual screening criteria used for inclusion: 1) Thermal modeling predicts suitability and 2) Fish presence in 10% or more of State’s water bodies. GFDL Climate Change Scenario Source: EPA, 1995
Bobolink Bird Distribution Low Density Medium Density High Density Source: Schneider and Root, 1997.
IPCC Second Assessment Report Conclusions • Climate has changed over the past century • Global mean surface air temperature has increased .5-1o F • Global sea level has risen 4-10 inches • Global precipitation over land has increased 1% • “The balance of evidence suggests a discernible human influence on global climate” (IPCC, 1995) • Climate is expected to continue to change in the future • Projected temperature increase of 3.6oF by 2100 (1.8-6.3oF) • Projected sea level rise of 20 inches by 2100 (6-38 inches) • Likely increase in precipitation intensity
There are still many uncertainties • Future emissions, biogeochemical cycling of GHGs and aerosols, and future concentrations • Representation of climate feedback processes in models • clouds, convection and precipitation, sea ice, vegetation, oceans • Detection and attribution • Non-linear responses (“Surprises”) and severe storms • Regional patterns of change