Ozone Depletion
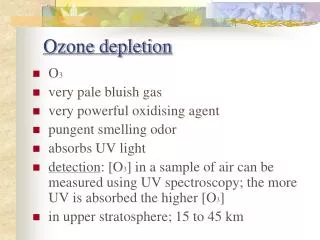
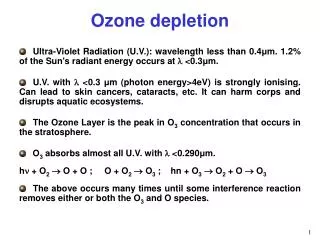
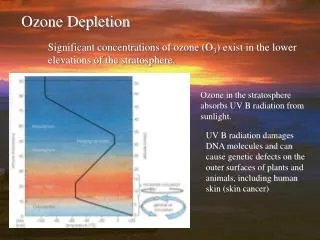
Ozone Depletion. Significant concentrations of ozone (O 3 ) exist in the lower elevations of the stratosphere. . Ozone in the stratosphere absorbs UV B radiation from sunlight.


Ozone Depletion
E N D
Presentation Transcript
Ozone Depletion Significant concentrations of ozone (O3) exist in the lower elevations of the stratosphere. Ozone in the stratosphere absorbs UV B radiation from sunlight. UV B radiation damages DNA molecules and can cause genetic defects on the outer surfaces of plants and animals, including human skin (skin cancer)
Ozone Depletion Results Each 1% loss of ozone leads to a 2% increase in UV radiation striking the earth. A 2% increase in UV radiation results in a 5% to 7% increase in skin cancer, including a 1% increase in deadly malignant melanoma
A 5% Ozone Depletion would cause: An additional 940,000 cases annually of basal-cell and squamous-cell skin cancer (disfiguring, but not usually deadly) An additional 30,000 cases annually of melanoma skin cancer (often fatal). There are 9,000 American deaths per year from this now. A sharp increase in eye cataracts and severe sunburn in people, cataracts in cattle. Suppression of the human immune system An increase in smog. The EPA estimates a 1% decrease in stratospheric ozone causes a 2% increase in ozone near the ground Reduced yields from crops like corn, rice, beans, and wheat Reduction in ocean phytoplankton growth Loss of $2 billion per year from materials degradation Increased global warming
Causes of Depletion Chlorine and Bromine in the Stratosphere CFC-11 (chlorofluoromethane) and CFC-12 (dichlorofluoromethane) are the most widely used as coolants for refrigerators and air conditioners
Sources Chlorofluorocarbons (CFC’s) Commonly called Freons (a Du Pont Chemical tradename) CFC-11 (chlorofluoromethane) and CFC-12 (dichlorofluoromethane) are the most widely used as coolants for refrigerators and air conditioners Also used as propellant in aerosol cans, industrial cleaner, hospital sterilant, fumigant, and to create bubbles in polystyrene plastic foam used for insulation and packaging. Halons Bromine containing compounds used in fire extinguishers Carbon Tetrachloride An industrial solvent Methyl Chloroform Solvent, correction fluid, dry cleaning spray, spray adhesive
United States accounts for largest part of world-wide consumption o CFC’s 29% of global consumption is from US Americans use six times more CFC’s than global average Vehicle air conditioners accounted for about 75% of annual CFC emissions in the US in 1990 Since 1978 the use of CFC’s in aerosol cans has been banned in many countries; however, worldwide, aerosol cans still account of 25% of CFC emissions
What do these compounds do? Spray cans, discarded and/or leaking refrigeration and air conditioning units, the production and burning of plastic foam products, and the use of solvents result in the release of these compounds into the environment. Most of these compounds are non-reactive and have lives of 22 to 111 years in the atmosphere. They circulate in the atmosphere until they reach the stratosphere. In the stratosphere they are broken down by UV radiation to release chlorine and bromine atoms Chemical reactions between chlorine or bromine and ozone cause ozone to degrade to O2 and O. Over time a single chlorine atom can cause the breakdown of as many as 100,000 molecules of ozone.
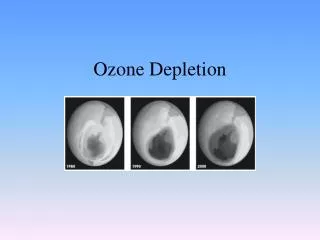
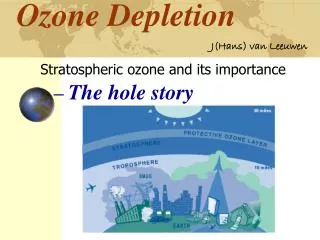
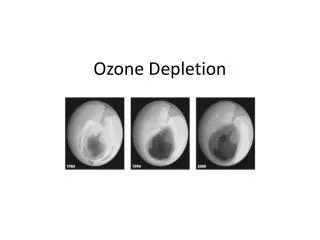
The Ozone Hole In the 1980’s researchers discovered that up to 50% of the ozone in the stratosphere over Antartica is destroyed between September and October (Arctic Spring). An area larger than the US Cause Vortexing winds with ice crystals that have absorbed CFC’s on the surface that lift CFC’s into the stratosphere and destroy the ozone at a fast rate. The vortex breaks up in a couple of months and large masses of ozone depleted air flow northward over parts of Australia, New Zealand and southern South America. During this time UV levels increase by as much as 20% there. A similar phenomenon has recently been observed in the Arctic regions
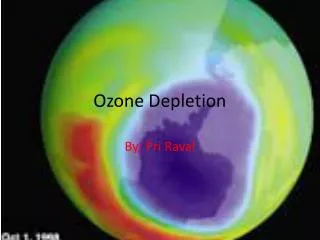
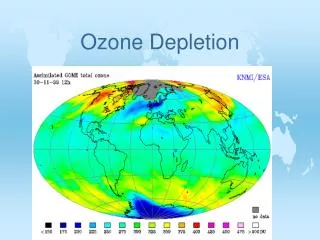
Satellite photo of south pole. Purple shade shows the extent of the ozone hole.
Ozone Depletion Observations Average drops in Ozone levels between 1969 and 1986
Protecting the Ozone Layer Ban the use of CFC’s Have to replace with something Current replacements are greenhouse gases and do not eliminate ozone depletion, just slow it down
Air Quality Standards Emission Standards Limit amounts of pollutants that can be emitted by pollution sources Generally set by State Air Quality Offices
Ambient Air Quality Standards The Clean Air Act, which was last amended in 1990, requires EPA to set National Ambient Air Quality Standards for pollutants considered harmful to public health and the environment. The Clean Air Act established two types of national air quality standards. Primary standards set limits to protect public health, including the health of "sensitive" populations such as asthmatics, children, and the elderly. Secondary standards set limits to protect public welfare, including protection against decreased visibility, damage to animals, crops, vegetation, and buildings. The EPA Office of Air Quality Planning and Standards (OAQPS) has set National Ambient Air Quality Standards for six principal pollutants, which are called "criteria" pollutants. They are listed below. Units of measure for the standards are parts per million (ppm) by volume, milligrams per cubic meter of air (mg/m3), and micrograms per cubic meter of air (µg/m3).
A guide to the Clean Air Act may be found at the EPA website: http://www.epa.gov/oar/oaqps/peg_caa/pegcaain.html#index