Download
1 / 27
270 likes | 403 Vues
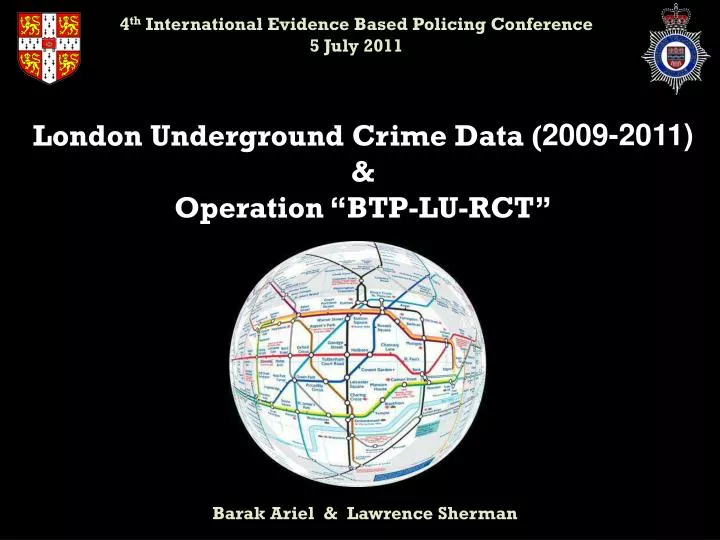
4 th International Evidence Based Policing Conference 5 July 2011. London Underground Crime Data ( 2009-2011) & Operation “ BTP -LU-RCT”. Barak Ariel & Lawrence Sherman. 79,694 Reported I ncidents / 40,484 Crimes. 2-year + Period 01/01/2009 – 28/02/2011 Across London Underground

E N D
4th International Evidence Based Policing Conference • 5 July 2011 London Underground Crime Data (2009-2011) & Operation “BTP-LU-RCT” Barak Ariel & Lawrence Sherman
79,694 Reported Incidents / 40,484 Crimes 2-year + Period 01/01/2009 – 28/02/2011 Across London Underground Hot Times Hot Stations Hot Lines Hot Platforms Big Questions: Time and Space concentrations of crime
25% of time (6 hrs) accounts for over 45% of all crimes per day
Day of the Week X Hour of Day 12 hours in these 4 days account for 26.2% of all LU crime
Crimes in Stations but NOT on Trains 2010 • 33 Stations (out of 334) produce 50% of all hard crimes* in London Underground * violence, sexual assaults, drugs, criminal damage, robbery, public disorder
Crimes on Platforms ONLY 2010 5% of platforms (n=15) produce 33% of all hard crimes
12 6 2 3 10 21 4 3 3 5 29 4 18 2 0 8 6 29 270 108 3 32 Bakerloo Line - Train & Platform crimes 2010 Data (n=588)
23 3 4 23 3 2 3 39 71 12 6 4 6 3 20 40 3 10 10 26 4 8 195 44 8 4 27 12 78 35 180 5 8 18 16 165 7 33 130 39 42 96 14 33 46 Central Line - Train & Platform Crimes 2010 Data (n=1195)
Research Hypthesis: • Police patrol in high-volume hotspots of crime in London Underground Platforms will reduce the frequency of reported crimes, compared to control conditions • Variations in Treatment: • patrol of a single police officer in hotspots • patrol of a team (2) of police officers (1 PC and 1 PCSO) in hotspots
Overall Design of RCT • Focus on top 150 Hot Platforms • Random allocation of patrol to treatment and control conditions: • premium service I (one officer; n=60) • premium service II (two officers; n=30) • Control group (business as usual; n=60) • Visit each experimental site for 15 Koper minutes, every 120 minutes, during hot hours, for 6 months.
Plan A Plan B • Select the hottest 300LU platforms • Look at all crime types • Block Random Assignmentof hot platforms to three experimental groups • A 12-months intervention period, with 24- months follow-up • Select the hottest150LU platforms • Define hotspots by location of hard-crimes only, in order to achieve 95% accuracy • Cluster Random Assignmentof hot 4-6 platforms that are closer to one another, to three experimental groups • A 6-months intervention period, with a 12- months follow-up
Exp’t Group 1 Top 60 Hotspots Exp’t Group 2 Control
Treatments:Each patrolling unit: • Visible patrolling; proactive policing • "directed-saturation patrol" • 3 experimental groups: 0 officers (n=60) 1 officer(n=60) 2 officers (n=30) • 6 Hours of patrolling during hot hours (4-10PM) • 60 participating officers • 15 Koper Minutes at a hotspot + 5 minutes travelling time between hotspots • Visit each hotspot receives every 120 (3 times per shift) • Every patrol unit can visit 15 hotspots per shift
Planned Analyses • (Before-After) number of crimes at hotspots • Diffusion of benefits / displacement to: • Catchment platforms within participating stations • Catchment stations in geographical proximity • Subgroup analyses, within distributions of • Crime volume • Passenger volume • Cost-Benefit Analyses • Longitudinal interviews of constables: power-holder legitimacy
4th International Evidence Based Policing Conference • 5 July 2011 London Underground Crime Data (2009-2011) & Operation “BTP-LU-RCT” Barak Ariel & Lawrence Sherman ba285@cam.ac.uk